

Solution guides
How to evaluate the mixing efficiency with GranuDrum?
This article presents a simple method for assessing the mixing efficiency of powders with different particle sizes using the GranuDrum.
Introduction
Achieving a homogeneous powder blend is a critical requirement in many industries. In pharmaceutical manufacturing, active ingredients must be uniformly distributed throughout the excipient to ensure consistent dosage from one tablet to another. In food production, ingredients must be evenly dispersed to guarantee identical product quality across all batches.
However, mixing powders efficiently is not always straightforward. Factors such as segregation, poor flowability, particle size differences, and the limited influence of thermal agitation in granular materials can significantly affect the blending process. For this reason, evaluating how easily powders can be mixed is essential for optimizing formulations, selecting mixing conditions, and ensuring product quality.
Why Measure Mixing Efficiency?
When powders of different particle sizes are mixed, the fine particles progressively fill the voids between the coarse particles. This process increases the packing efficiency of the blend and leads to a reduction in bulk volume. Monitoring this volume evolution provides valuable information about:
- The extent of mixing achieved.
- The rate at which mixing occurs.
- The quality of the final blend.
- The effectiveness of the mixing process.
The GranuDrum makes it possible to follow this evolution dynamically and extract quantitative metrics that describe mixing performance.
Simulating the Mixing Process
The method starts with two initially separated powders exhibiting different particle sizes. A layer of fine powder is first introduced into the drum, followed by a layer of coarse powder, creating a deliberately demixed state. The GranuDrum is then operated at a low rotational speed, allowing the powder bed to progressively mix. Because mixing causes fine particles to occupy the void spaces between coarse particles, the bulk volume decreases during the experiment.
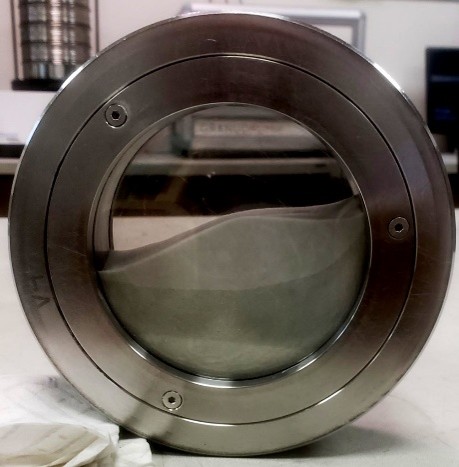
Figure 1: Example of unmixed powders for the test.
Monitoring Blend Evolution with the GranuDrum
A series of consecutive measurements is performed at a constant rotational speed of 2 rpm. As mixing progresses:
- Fine particles migrate into the voids.
- Packing density increases.
- Bulk volume decreases.
- The filling ratio of the drum evolves with time.
The filling ratio, available in the raw GranuDrum data, becomes a direct indicator of the mixing process. Tracking this parameter provides a simple way to quantify blend evolution without requiring additional sampling or analytical techniques.
Understanding the Filling Ratio Evolution
Figure 2 shows a typical evolution of filling ratio as a function of time. At the beginning of the test, the powders are poorly mixed and the packing efficiency remains relatively low. As mixing progresses, the filling ratio decreases until reaching a stable value corresponding to the mixed state.
Two key metrics can be extracted from this evolution:
ΔFR - Mixing Intensity
The amplitude of the decrease in filling ratio is defined as: ΔFR = FR₀ − FR∞
where:
- FR₀ is the initial filling ratio at the beginning of the test.
- FR∞ is the asymptotic filling ratio after complete mixing.
A larger ΔFR indicates that the blend undergoes a more significant structural rearrangement and generally reflects more effective mixing.
τ – Characteristic Mixing Time
The characteristic time τ describes how quickly the filling ratio decreases.
A smaller τ indicates faster mixing and therefore a more efficient blending process.
Modeling the Mixing Process
The evolution of the filling ratio can be described by the following exponential law:
FR(t) = (FR₀ − FR∞) e (-t/τ) + FR∞
This equation allows the experimental data to be fitted and the two key metrics, ΔFR and τ, to be determined.
Together, these parameters provide a quantitative description of both:
- The intensity of mixing.
- The speed of mixing.
Example: Titanium Alloy Powders
Figure 2 illustrates the behavior of a blend composed of titanium alloy powders with different particle sizes.As the drum rotates, the fine particles progressively fill the spaces between the larger particles, causing the filling ratio to decrease. The observed evolution follows the expected exponential trend and allows both ΔFR and τ to be extracted.
A significant decrease in filling ratio combined with a short characteristic time indicates efficient and rapid mixing of the two particle populations.
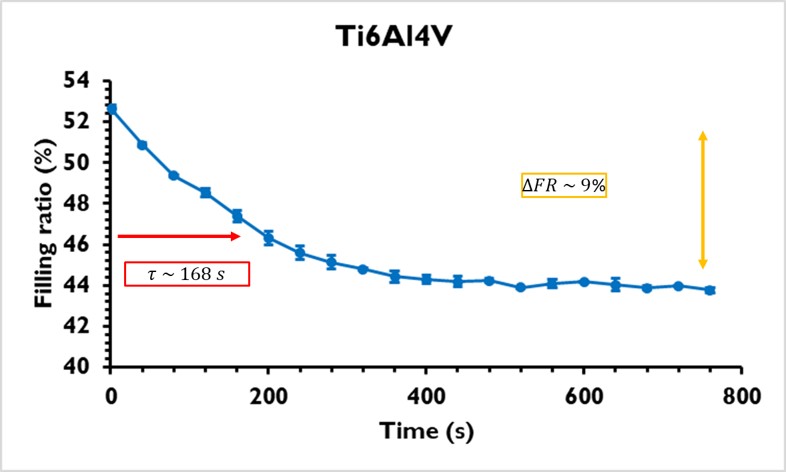
Figure 2: Evolution of the filling ratio with time for blend of titanium alloy made of two sizes of grain.
Applications of the Method
This protocol is particularly useful for evaluating:
- Powder blending operations.
- Mixing equipment performance.
- Effects of particle-size distributions.
- Formulation optimization.
- Process scale-up studies.
It can also be used to compare different raw materials or determine optimal mixing times.
Industrial Applications
Mixing-efficiency measurements are relevant for:
- Pharmaceutical formulations
- Food ingredients
- Battery materials
- Powder metallurgy
- Additive manufacturing powders
- Specialty chemicals
The method provides a simple way to quantify blending performance while using the same instrument that is already employed for flowability characterization.
Conclusion
The GranuDrum provides a straightforward and quantitative method for evaluating mixing efficiency in powder blends composed of particles with different sizes.
By monitoring the evolution of the filling ratio during mixing, users can determine two complementary metrics:
- ΔFR, which quantifies mixing intensity.
- τ, which characterizes the mixing rate.
Together, these parameters provide valuable insight into the ability of a powder blend to mix efficiently and can support formulation development, process optimization, and quality control.
FAQ – Evaluating Mixing Efficiency with the GranuDrum
Why does the filling ratio decrease during mixing?
Fine particles progressively fill the voids between coarse particles, increasing packing density and reducing the bulk volume occupied by the blend.
What does the parameter ΔFR represent?
ΔFR represents the total decrease in filling ratio between the initial and fully mixed states and reflects the intensity of mixing.
What does the characteristic time τ indicate?
τ describes the speed of the mixing process. Lower τ values indicate faster mixing and improved blending efficiency.
Can this method be used to compare different powder formulations?
Yes. Comparing ΔFR and τ values allows different powder blends, particle size distributions, or mixing conditions to be evaluated quantitatively.
Why is a low rotational speed used during the test?
A low rotational speed promotes progressive mixing while allowing the evolution of packing and filling ratio to be monitored over time.