Application notes
Predicting Powder Spreadability in Metal AM: Combining Powder Characterization and DEM Simulations
This study by Dr. Aurélien Neveu links powder cohesiveness to spreadability using GranuDrum, in‑printer imaging, and DEM simulations, confirming cohesion as a key predictor of layer quality in metal additive manufacturing.
Spreadability of Metal Powders: Combining Characterization & DEM Simulations
A good prediction of powder spreadability is essential in powder bed-based additive manufacturing to guarantee the quality of the built parts. In this study, we combine powder characterization in the GranuDrum and layer quality evaluation in an instrumented test bench (LEM3, France). The results demonstrate the strong link between powder cohesiveness and spatial irregularities of the produced layers. The experimental study is complemented by a DEM investigation, in which the bed and recoater configurations are similar to the experimental ones. The DEM simulation allows investigating more deeply the spreading mechanisms by giving access to measurements that are difficult to obtain experimentally. Especially, we study the link between the strength of the cohesive forces acting between the particles and its consequences on the layer irregularity.
1. Introduction
Powder Bed Fusion (PBF) additive manufacturing technologies are gaining a lot of interest in the production of complex metal parts. The main advantage of PBF methods is the ability to produce parts of complex geometry impossible to achieve with conventional machining. Moreover, it allows complex design based on topology optimization in order to reduce part weight while guaranteeing its mechanical properties. This opens up new interesting possibilities for applications in domains such as aerospace, medical implants, or automotive sectors [1-3].
In Powder Bed Fusion (PBF) processes, successive thin layers of powder are deposited with a recoater, usually a ruler or a rotating cylinder. An energy beam (laser or electron beam) then scans the powder bed following a pre-defined path to locally sinter or melt the powder. The operation is repeated for each successive layer to produce the built part. The vertical resolution and mechanical properties of the built parts require thin layers with a height smaller than 100 µm. Unfortunately, the powder flowability usually decreases with smaller particles as a consequence of an increase in powder cohesiveness. Furthermore, the homogeneity of the powder layer is a key parameter to guarantee the mechanical properties of the final parts [4]. Visual observation of layer homogeneity is usually the only way for operators to quantify the spreadability of powders during the recoating. Relating the powder characteristics to its spreadability during the recoating process beforehand should provide a more cost-effective way to classify and select the optimal powder and recoating speed combinations.
In previous work, Yablokova et al. [5] have shown that the spreadability of Ti alloys evaluated in a test bench can be related to the cohesiveness evaluated in a rotating drum (GranuDrum, GranuTools, Belgium). They propose the idea of defining a threshold in Cohesive Index, a GranuDrum metric for cohesion, to have a pass/fail test, allowing the prediction of the powder spreadability in the machine. More recently, Neveu et al. [6] have investigated the relation between the Cohesive Index and the spreadability evaluated directly inside the printer. To this end, a methodology has been developed to have a measure of the layers inhomogeneities from pictures of the power bed. This method has been recently published as an ISO/ASTM standard [7]. The correlation between the Cohesive Index and the spreadability has also been applied to the evaluation of Iron ores as a suitable feedstock for powder bed based AM [8].
In the present study, we extend the previous works and propose to more deeply evaluate the correlation between the powder cohesiveness and its ability to produce spatially homogeneous layers by recoater in a Selective Laser Melting (SLM) process. The spreadability of different metal powders has been determined directly inside an SLM®280 printer. In parallel, the powder cohesiveness is evaluated in a rotating drum method. This study aims to demonstrate the validity of the correlation between the Cohesive Index and spreadability to a broader range of materials. The experimental investigation is complemented with a preliminary numerical study to confirm the link between cohesion and spreadability. In the following, the methods used will be presented. The obtained results will demonstrate the strong link between the strength of the powder cohesion and the ability of the powder to produce homogeneous layers.
2. Material and Methods
2.1. Materials
For this study, nine metal powders have been selected for cohesiveness and spreadability evaluation. The powders are common materials used in metal AM, mainly Titanium alloys, Aluminum alloys, 316L and FeCo. The particle size distribution covers a range from 10 µm to 105 µm to provide a wide range of powder cohesiveness. Samples name, types and size ranges are reported in Table 1.
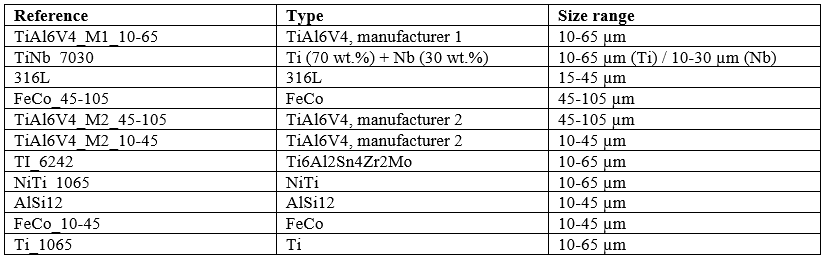
Table 1. Description of the powders used in this study.
2.2. Spreadability evaluation
The spreadability has been evaluated in an SLM®280 (SLM Solutions, Germany). For each material, 15 successive layers were recoated on top of each other, without emptying the powder bed between each recoater pass. Several initialization layers were recoater to ensure that the first of the 15 analyzed layers were produced over a fully covered powder bed. This operation prevented from having light reflection due to the plateau that would be wrongly interpreted as inhomogeneities on the pictures. Due to the large number of materials tested in this study, the recoated was filled manually to prevent long cleaning times of the complete alimentation system of the machine. Between two different materials, the powder bed and recoater were thoroughly cleaned. The recoater speed was set at 424 mm/s.
The evaluation of the spreadability of the powders consisted of two steps. First, the acquisition of the pictures of the powder bed after each recoater pass, then a processing of these pictures to evaluate the inhomogeneity of the layer.
2.3. Image acquisition
After each recoater pass, a picture of the powder bed is taken using the built-in camera system of the SLM280. The printer comprises two cameras, the “inspect camera” and the “LCS” camera (figure 1). The SLM280 LCS camera is used to control defects in the build during printing and thus produces images of the full powder bed. Therefore, the spreadability has been evaluated based on the pictures provided by the LCS. Four LED stripes placed at each side of the build chamber provided the required lighting. The choice was made in this study to use only the camera and lighting system of the SLM280 so that the proposed method could be easily implemented on existing systems without a hardware upgrade.
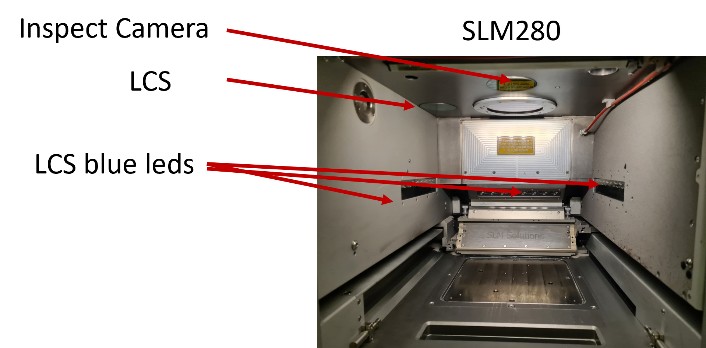
Fig. 1. Build plate of the SLM280 with the built-in image acquisition setup.
2.4. Interface fluctuation evaluation
The pictures acquired in the machine are post-processed to evaluate the homogeneity of the deposited layer. The pictures are 8 bits grayscale images with pixel levels ranging from 0 to 255. For each picture, pixel intensity profiles are extracted along horizontal and vertical lines, as depicted in figure 2. The lines are equally spaced over the horizontal and vertical dimensions. The layer can show localized defects that do not fully cover the build plate. Therefore, it is important to use a sufficient number of lines in each direction to ensure that such layer irregularities will be taken into account. In this study, 50 horizontal and 50 vertical lines were used, so 100 pixels profiles in total.
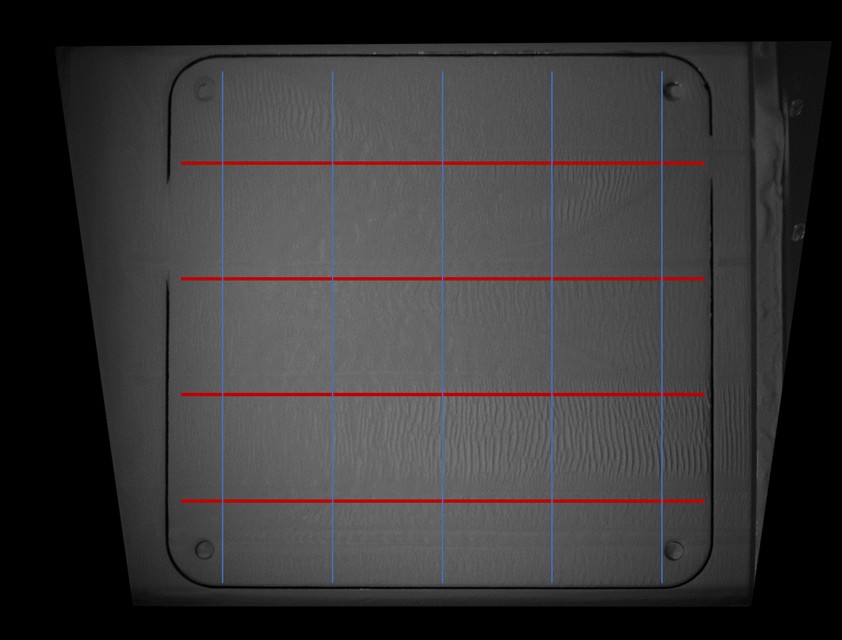
Fig. 2. Horizontal and vertical lines along which the pixel profiles were extracted. For the sake of clarity, only few lines are shown, the real analysis used 50 horizontal and 50 vertical lines.
The pixel profiles were then normalized by dividing each pixel value by the average value computed over the pixels of the profile. This was done to account for small variations of luminosity across the picture due to not perfectly homogeneous lighting. A zoom of a typical pixel profile is presented in figure 3 (a). A “smoothed” profile was then computed from the normalized profile (figure 3 (b)). Different methods could have been chosen to obtain this smooth profile, but in this study, a simple centered rolling mean method was used. The frame size of the rolling mean was expected to influence the shape of the smoothed profile and thus the evaluation of the fluctuations. This was investigated and we determined that for size frames larger than around 15 pixels no significant differences were observed in the smoothed profile shape and the measured fluctuation. Therefore, a size frame of 17 pixels was chosen for the analysis.
At each pixel position, the difference between the real profile and the smoothed profile was measured, corresponding to the local fluctuation of the profile (figure 3 (c)). The total fluctuation of the profile was then computed as the standard deviation of all the local fluctuations. A profile fluctuation was thus obtained for each profile. As 100 profiles were extracted (50 horizontal / 50 vertical), the same number of profile fluctuations were computed. Finally, the powder layer Interface Fluctuation (IF) was computed as the arithmetic average of the profile fluctuations. Inhomogeneities of the powder layer will lead to higher values of the Interface Fluctuation (IF).
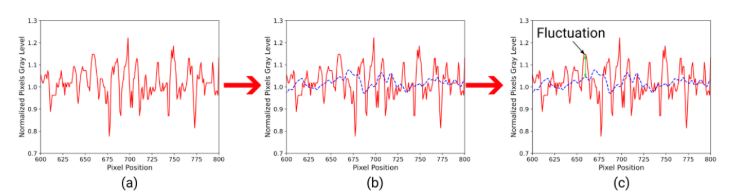
Fig. 3. (a) Normalized pixels profile extracted along a line (zoomed in). (b) Computed smoothed profile superimposed to the normalized profile. (c) Evaluation of the local fluctuations of the pixel profile.
2.5. Flowability and cohesion characterization
The flowability and cohesion of the powders were evaluated by a rotating drum method (GranuDrum). A horizontal cylinder with transparent glass sidewalls is half-filled with a sample of powder. The drum rotated around its axis at an angular velocity ranging from 2 rpm to 60 rpm. At each angular velocity, 40 snapshots separated by 1s were taken by a CCD (Charge-coupled device) camera. The air/powder interface was detected on each snapshot with an edge detection algorithm. Afterward, the average interface position and the fluctuations around this average position were computed. Then, for each rotating speed, the dynamic angle of repose (DAOR) was computed from the average interface position and the cohesive index (CI) was measured from the temporal fluctuations of the interface.
The Cohesive Index is only related to the cohesive forces between the particles [9, 10]. A cohesive powder leads to a disturbed flow while a non-cohesive powder leads to a regular flow. Therefore, a Cohesive Index close to zero corresponds to a non-cohesive powder. When the powder cohesiveness increases, the cohesive index increases accordingly. Moreover, investigating different rotating speeds gives access to the rheological behavior of the powder, i.e. its response to an increasing applied stress. A complete description of the GranuDrum Cohesive Index metric can be found in Neveu et al. [11].
2.6. DEM simulation
Discrete Element Method (DEM) simulations have been performed to investigate the link between cohesive strength and layers irregularities during the recoating. The simulations have been run using PICI-LIGGGHTS, a modified version of the open-source LIGGGHTS software [12]. The Hertz-Mindlin contact model to calculate the normal and tangential forces on the particles, energy dissipation due to the coefficient of restitution and the implementation of the sliding friction coefficient (μs). The constant directional torque (CDT) model [13] was used for the rolling friction and the simplified Johnson-Kendall-Roberts (SJKR) model [14] for inter-particle cohesive forces via the cohesive energy density (CED) coefficient. The model parameters values are determined using digital twins of the real instruments [15].
3. Results and discussion
Figure 4 presents the flowability curves measured with the GranuDrum for the different powders. The Cohesive Index (CI) is reported for a range of rotating speeds from 2 to 60 rpm. The selected materials cover a wide range of CI and thus demonstrate different flowabilities. The two powders with the large particle sizes (FeCo_45-105 and TiAl6V4_M2_45-105) show the lowest CI and thus the best flowability. The decrease of cohesiveness is commonly observed when the particle sizes is increased. Powder with a CI below 20 are usually considered having a good flowability. Most of the tested powders have a CI between 10 and 25, which is consistent with the use of these materials for the SLM process. The Aluminum alloy (AlSi12) demonstrates a higher CI above 30. This powder thus denotes poor flowability and is expected to have the lowest processability. It can be noted that the high repeatability of the measurements allows to clearly differentiate and classify the powders. Most of the powders show a quite stable cohesiveness with respect to increasing rotating speeds
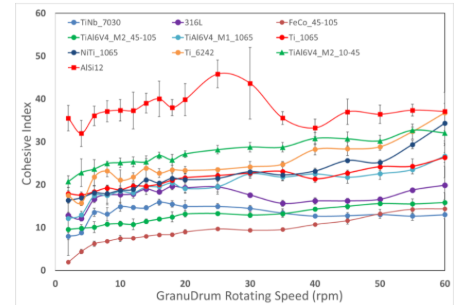
Fig. 4. The Cohesive Index measured for rotating speeds ranging from 2 to 60 rpm. Errors bars are ± the standard deviation around the mean computed over the three repeatability tests. Errors bars might be comprised in the thickness of the markers.
Powder cohesiveness is expected to influence the spreadability of the powder. Indeed, the presence of strong cohesive interactions between the particles will oppose the homogeneous particle deposition by the recoater. Moreover, the gap between the recoater blade and the powder bed, corresponding to the target layer thickness, is usually not bigger than a few particle diameters. Therefore, for cohesive powders that have the tendency to form particle agglomerates, this can lead to particle blockage close to the recoater and spatial defects of the deposited layer. A close link between the Cohesive Index and powder spreadability is thus expected.
Figure 5 presents the Cohesive Index and the corresponding Interface Fluctuation for the different powders. The GranuDrum rotating speed has been chosen as the closest match between the tangential speed of the drum and the translational speed of the recoater. The recoater speed was 424 mm/s which corresponds to a tangential of 97 rpm. Therefore, the maximum rotating speed of 60 rpm was selected. This is to be taken as a rough relation between recoater speed and drum tangential speed, a finer relation will be derived in future work. A clear trend emerges: the higher the Cohesive Index of the powder, the higher the Interface Fluctuation and thus the lower the spreadability. A clear trend was observed: the higher the Cohesive Index, the higher the Interface Fluctuation and thus the lower the spreadability. This indicates a strong link between the strength of the cohesion of the material and its ability to produce spatially homogeneous layers. These results are consistent with the ones obtained in previous studies [6,7] The Aluminum alloy AlSi12 exhibits the highest Interface Fluctuation, denoting strong inhomogeneities of the recoater layers.
An inconsistency was found for the TiAl64V_M1_10-65, which had the lowest Interface Fluctuation despite a Cohesive Index between 20 and 25. With visual observations of the layer pictures, some low amplitude inhomogeneities were observed which were not correctly accounted for by the image processing. Therefore, the layer quality evaluation is found to be not fully satisfying for this case. These results open up new perspectives to predict material spreadability. Indeed, if a threshold in Interface Fluctuation corresponding to the minimum acceptable spreadability can be defined for the machine, a quick and simple evaluation of the Cohesive Index should allow predicting if the powder will produce sufficiently homogeneous layers during the recoating.
To better understand the relation between the strength of the cohesive interactions lying between the particles, measured indirectly by the Cohesive Index metric, and the spreadability observed in the printer, a preliminary numerical study has been performed. Figure 6 presents a typical layer obtained in the simulation for a non-cohesive and slightly cohesive material.
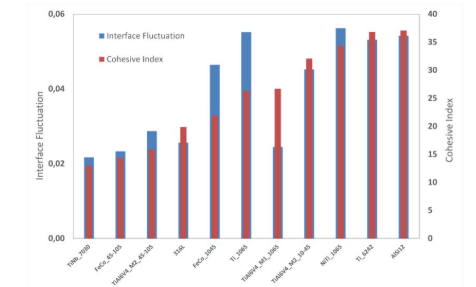
Fig. 5. Correlation between the GranuDrum Cohesive Index and the layers interface fluctuation.
Upon increasing the cohesiveness, spatial irregularities appear leading to an increase of the layer roughness, confirming the experimental observations in the printer. For the sake of comparison with the experimental results, Interface Fluctuations has been computed in a similar way than the pictures taken in the printer. However, as in the simulation the position of all the particles is easily accessible, the Interface Fluctuations are directly computed based on the particle’s positions rather than pixel intensity profiles. Therefore, only general trends can be compared between the experimental and numerical results for the present work.
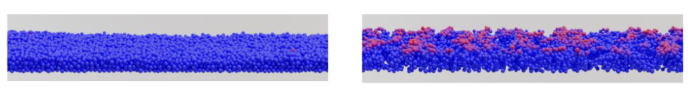
Fig. 6. Left: Smooth layer produced by non-cohesive powder. Right: Irregularities arising from cohesion.
Figure 7 shows the Interface Fluctuations versus the Cohesive Energy Density. The increase in layer roughness is clearly evidenced for higher values of the Cohesive Energy Density (CED) parameter. Increasing the strength of the cohesive interactions between the particles leads to a strong increase the spatial fluctuations of the layer and is thus detrimental for the layer quality.
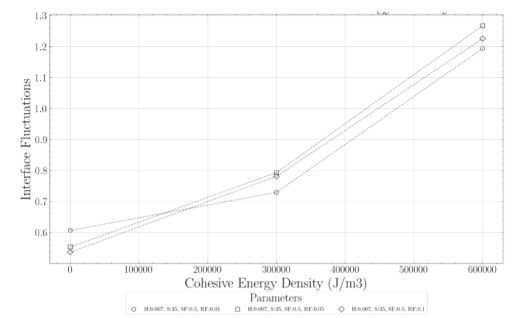
Fig. 7. Interface fluctuations versus Cohesive Energy Density for three values of the rolling friction.
The influence of the rolling friction is also presented in figure 7. Indeed, the rolling friction can be expected to contribute to the global cohesiveness by opposing relative motion of the particles at contact. However, no clear influence of the rolling friction on the layer quality is observed, thus confirming that the powder spreadability is mainly driven by cohesion.
4. Conclusion
The spreadability of a broad range of typical powders used in AM was evaluated and correlated with their cohesiveness measured in a rotating drum. The spatial homogeneity of the recoated layers was evaluated directly inside the SLM280 printer with a built-in image acquisition system. Then, an image processing algorithm was applied to quantify precisely the inhomogeneities of the layers via the Interface Fluctuation metric, following the ISO/ASTM TR 52952:2023 protocol.
The presented results confirm the observation of the previous studies. Therefore, the relation between the Cohesive Index and the spreadability seems to be true for all kinds of materials. This confirms the assumption of a strong link between powder cohesiveness and the ability to form homogeneous layers. Some limitations of the image processing algorithm have been pointed out, indicating that some improvements are needed. The influence of the recoater speed has also been investigated for some of the powders. A relation between powder rheology and spreadability is observed. Therefore, a match between the recoater and GranuDrum speed is necessary for an accurate powder spreadability prediction. Furthermore, the results obtained with the numerical analysis confirm the link between cohesive strength and spreadability.
By Dr. Aurélien Neveu, Head of laboratory and applications, Granutools
FAQ – Predicting Powder Spreadability in Metal AM
What is powder spreadability in metal additive manufacturing?
Powder spreadability is the ability of a powder to form thin, homogeneous layers during recoating in powder bed fusion processes.
Which powder property best predicts spreadability?
Powder cohesiveness, quantified by the GranuDrum Cohesive Index, is a key predictor of layer homogeneity and spreadability.
How is powder cohesiveness measured?
Cohesiveness is measured using a rotating drum method (GranuDrum) by analyzing surface fluctuations during powder flow.
Why combine experiments with DEM simulations?
DEM simulations provide insight into particle-scale mechanisms and confirm the influence of cohesive forces on layer irregularities.
How can this approach support powder selection in AM?
By linking GranuDrum cohesion data to spreadability, powders can be screened and classified before printing to reduce trial-and-error.
References
[2] D. Herzog et al., Additive Manufacturing of Metals, Acta Materialia 117 (2016).
[3] T.D. Ngo et al., Additive manufacturing: a review, Compos. Part B Eng. 143 (2018).
[4] Q.B. Nguyen et al., Powder layer thickness in SLM, Arch. Civ. Mech. Eng. 18 (2018).
[5] G. Yablokova et al., Rheological behavior of Ti powders, Powder Technology 283 (2015).
[6] A. Neveu et al., Spreadability/c cohesion correlation in PBF, Progress in AM (2020).
[8] C. Quilter et al., Iron Ore Feedstock for AM, EuroPM2023.
[9] G. Lumay et al., Measuring flowing properties of powders, Powder Technology 224 (2012).
[10] M.M. Osman et al., Evaluation of the GranuDrum®, Int. J. Powder Metallurgy 56 (2020).
[11] A. Neveu et al., Powder flow in a rotating drum, Measurement 200 (2022).