Application notes
Packing dynamic as a quantification tool for PTFE fibrillation
Explore the impact of fibrillation time on powder packing dynamics in our application note. Discover insights into optimizing battery powder blend processes for enhanced performance and efficiency.


Introduction
Why PTFE fibrillation is envisaged
Dry-coating has become a popular process for electrode production due to its great advantages compared to slurry-based processes. The production cost, in money and carbon footprint, is highly reduced because the drying step, known to consume a lot of energy and time, is simply removed. The material is directly handled in powder form, in dry conditions. In addition, the problems of chemical compatibility and the toxicity of the solvent are completely fixed in such conditions. Therefore, more and more battery/electrode manufacturers turn to this new solution.
Such advantages are however counterbalanced by new challenges to overcome. Indeed, powder handling is generally challenging due to rheological behaviors complexifying the process optimization. The processes involving powders for electrode dry-coating are promising but still need improvement to replace slurry-based coating technologies. One of the most developed is dry-coating based on direct calendering of powder material. This powder must exhibit a plasticizing behavior to transform the granular material into a sheet with adequate consistency. This consistency is crucial to be able to paste the produced sheet on a current collector.
For having such plasticizing behavior, Polytetrafluoroethylene (PTFE) is generally added as a binder with active material and conductive additive. The PTFE is a polymer with long chains that are naturally agglomerated in their initial form. The powder blend must be fibrillated to activate the plasticizing properties of the PTFE. Fibrillation is the process consisting of applying a high shear rate to the powder material to transform the PTFE agglomerates into long fibrils (see Figure 1). These fibrils create a network between active material (and binder) particles that are responsible for the consistency of the created sheet.
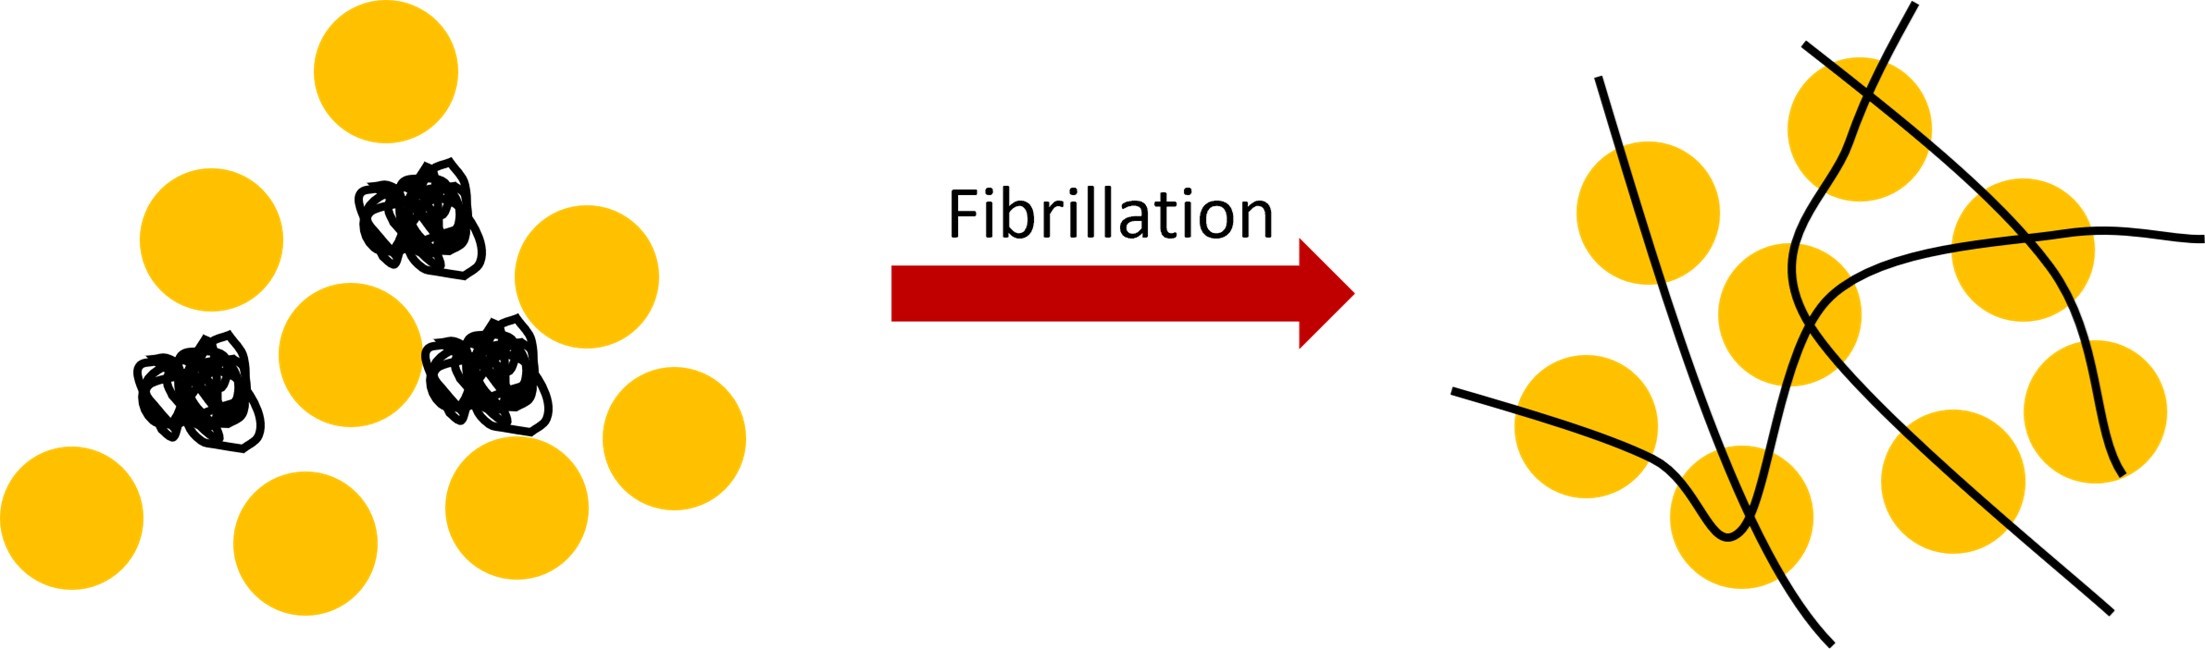
Figure 1: Sketch of the fibrillation principle
PTFE fibrillation is thus an important step to control and to improve. Indeed, the homogeneity and the solidity of the electrode directly depend on this fibril network. Consequently, the powder material must be sufficiently fibrillated to guarantee optimal quality for the sheet that will be processed for the dry-coating. However, these fibrils are also responsible for a change in the powder flowability. Indeed, as observed in granular chains (see Figure 2), the larger and more numerous the chains the larger the entanglement between PTFE particles, reducing their mobility and thus the powder flowability. Accordingly, the powder material must be not fibrillated too much to ensure sufficient flowability, necessary to make it usable for the manufacturing process.
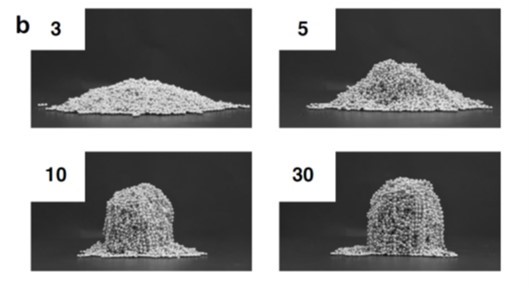
Figure 2: Effect of the length N (number of beads) of the granular chain on the static angle of repose. Picture from [1]
Scope of the study
Although dry-coating processes based on PTFE fibrillation are promising for replacing slurry-based ones, the fibrillation step represents a challenge to take on. The ‘’degree’’ of fibrillation must be optimized to reach the processability requirements of the powder material as well as a good consistency for the material sheet. Currently, there is no accurate and standardized method to quantify this degree of fibrillation. The characterization and the quantification of the degree of fibrillation of the powder blend is an obstacle to overcome for optimization.
Scanning Electron Microscope (SEM) imaging or Particle Size Distribution (PSD) by laser diffraction are useful approaches to qualitatively characterize changes happening in the powder due to the formation of fibrils. Unfortunately, these measurements are often expensive and time-consuming, (as for SEM imaging) or are not reliable for quantification (as for laser diffraction PSD). Indeed, for SEM imaging, the sample must be prepared by a succession of complex steps before image acquisition. Furthermore, the observation of fibrils or not depend on the investigated region. Consequently, several pictures should be taken for each batch for statistically improving an analysis based on SEM images. The laser diffraction technique for PSD is based on the assumption of spherical particles to measure the typical size of grains. Since fibrils are very asymmetrical particles, the meaning of the size distribution must be evaluated with some care. Therefore, a precise, simple and cheaper method must be put in place to quantify the fibrillation of PTFE in powder blends, allowing dry-coating process improvement.
In this work, we demonstrate how tapped density measurement, performed with the GranuPack, can be used to quantitatively and accurately characterize the fibrillation state of PTFE in a cathode material blend. The results are corroborated by laser diffraction PSD and SEM images which confirm the presence of fibrils. Based on the link between the presence of fibrils and the change in powder rheology, the packing dynamics are analyzed and interpreted. Physical links between packing speed and particle entanglement coming from fibril are assumed and open the way to the definition of a good ‘’degree of fibrillation’’ metric.
Powders characteristics and preparation
Material
In this work, five powder samples were analyzed. All of them come from an initial batch made of majoritary Lithium Iron Phosphate (IBUvolt® LFP400), some Carbon Black, and a minority of PTFE (Daikin Chemical Europe GmbH). The powder blend was mixed and then sheared with an Eirich mixer (5L) to fibrillate the PTFE. From the same powder batch, the five powders were sampled at different times from the Eirich mixer, between 0 (the P1 sample was considered as not fibrillated) and 5 min (P5 powder). In this way, samples with different degrees of fibrillation were obtained, giving different behaviors and consistency that can be observed by naked eyes, as presented in Figure 3.
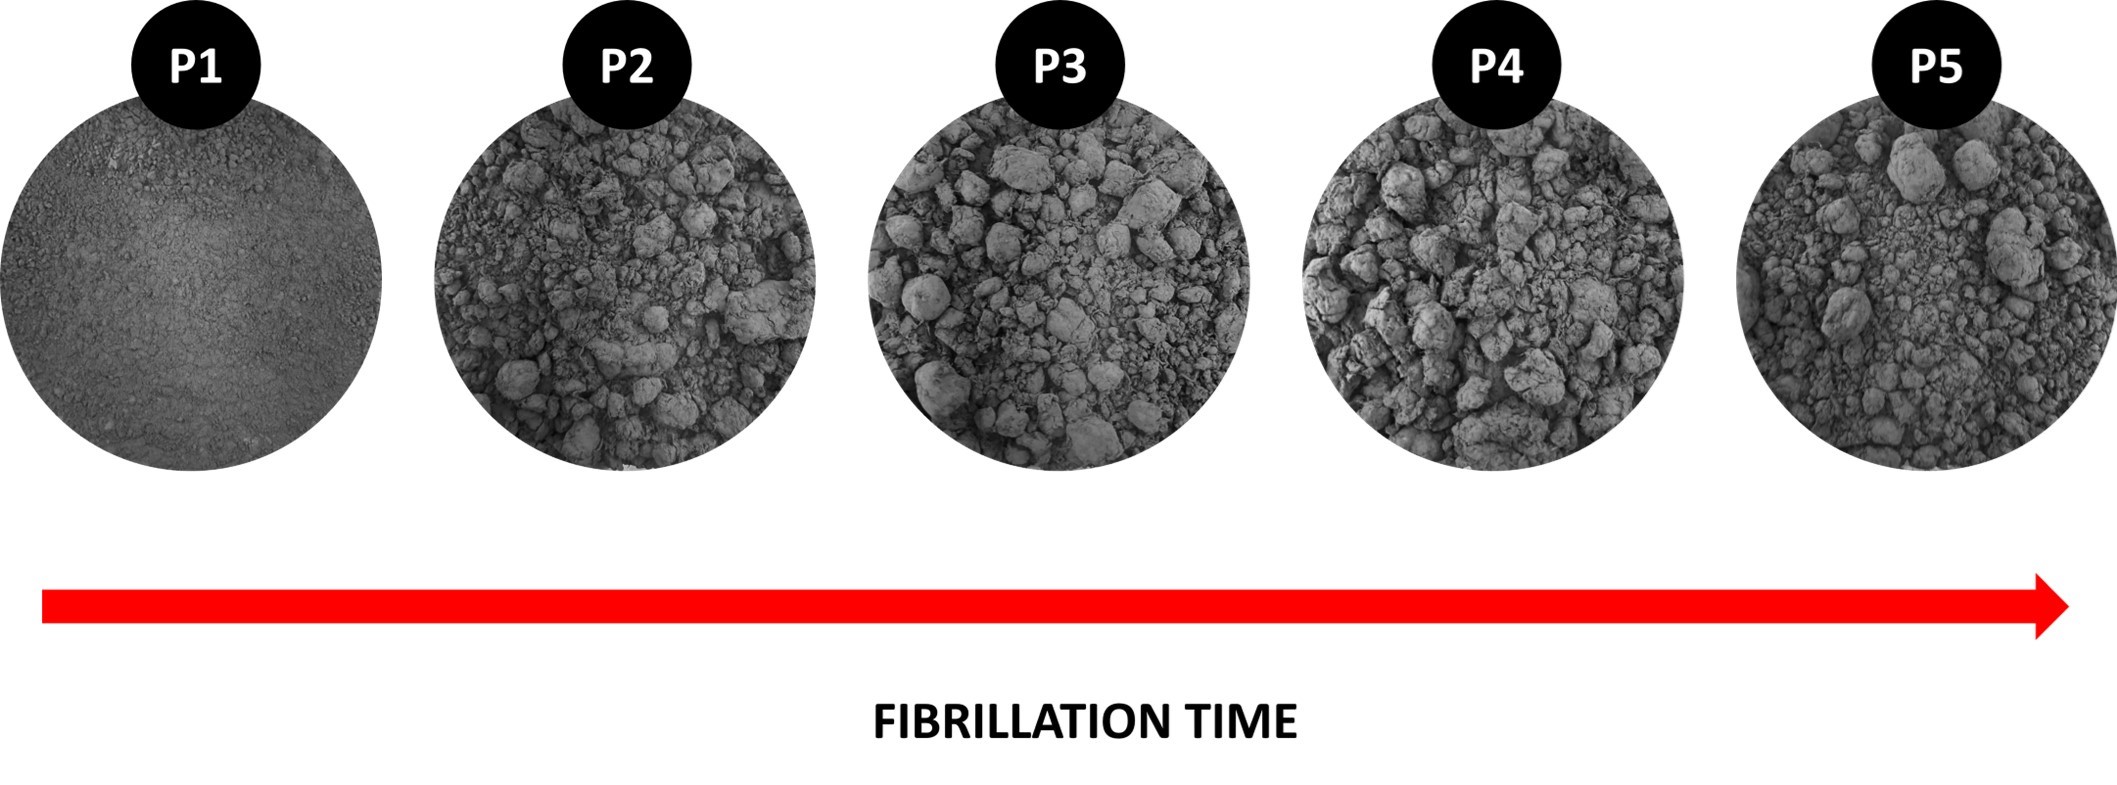
Figure 3: Pictures of the different powder samples ranked from the lowest fibrillation time to the largest. (Photographies taken and provided by Marcella Horst, IPAT).
Particle Size Distribution
Experimental protocol
Particle Size Distribution analysis was performed to detect the formation of fibrils due to fibrillation. The measurement is performed by laser diffraction. A Partica LA-960 device from Horiba Ltd was used.
Experimental results
The results are presented in Figure 4. On the graphic, powder material without PTFE has a narrow size distribution, gaussian-like centered around 10 µm (see grey curves). Adding agglomerated PTFE does not significantly change the average particle size as it is observed on the black curve for the not-fibrillated powder P1 (0 min of fibrillation time). The larger distribution probably comes from agglomerated PTFE particles that have different particle sizes than the blend LFP + CB. On the contrary, fibrillating the PTFE increases the range of the distribution. A peak appears beyond 100 µm and grows from P1 to P4 and increases as the fibrillation time increases (see dark red, red and orange curves). This attests to the creation of fibrils that increase the typical size of particles inside the blend. However, after 5 min of fibrillation (P5 powder), this peak is divided into two, as observed on the yellow curve. The break of some fibrils into two parts may be an interpretation of this split. Indeed, fibrillation is a complex process that needs to be controlled accurately. Too short a time results in an insufficiently fibrillated material while too long a fibrillation time can break fibrils and decreases the degree of fibrillation of the powder material.
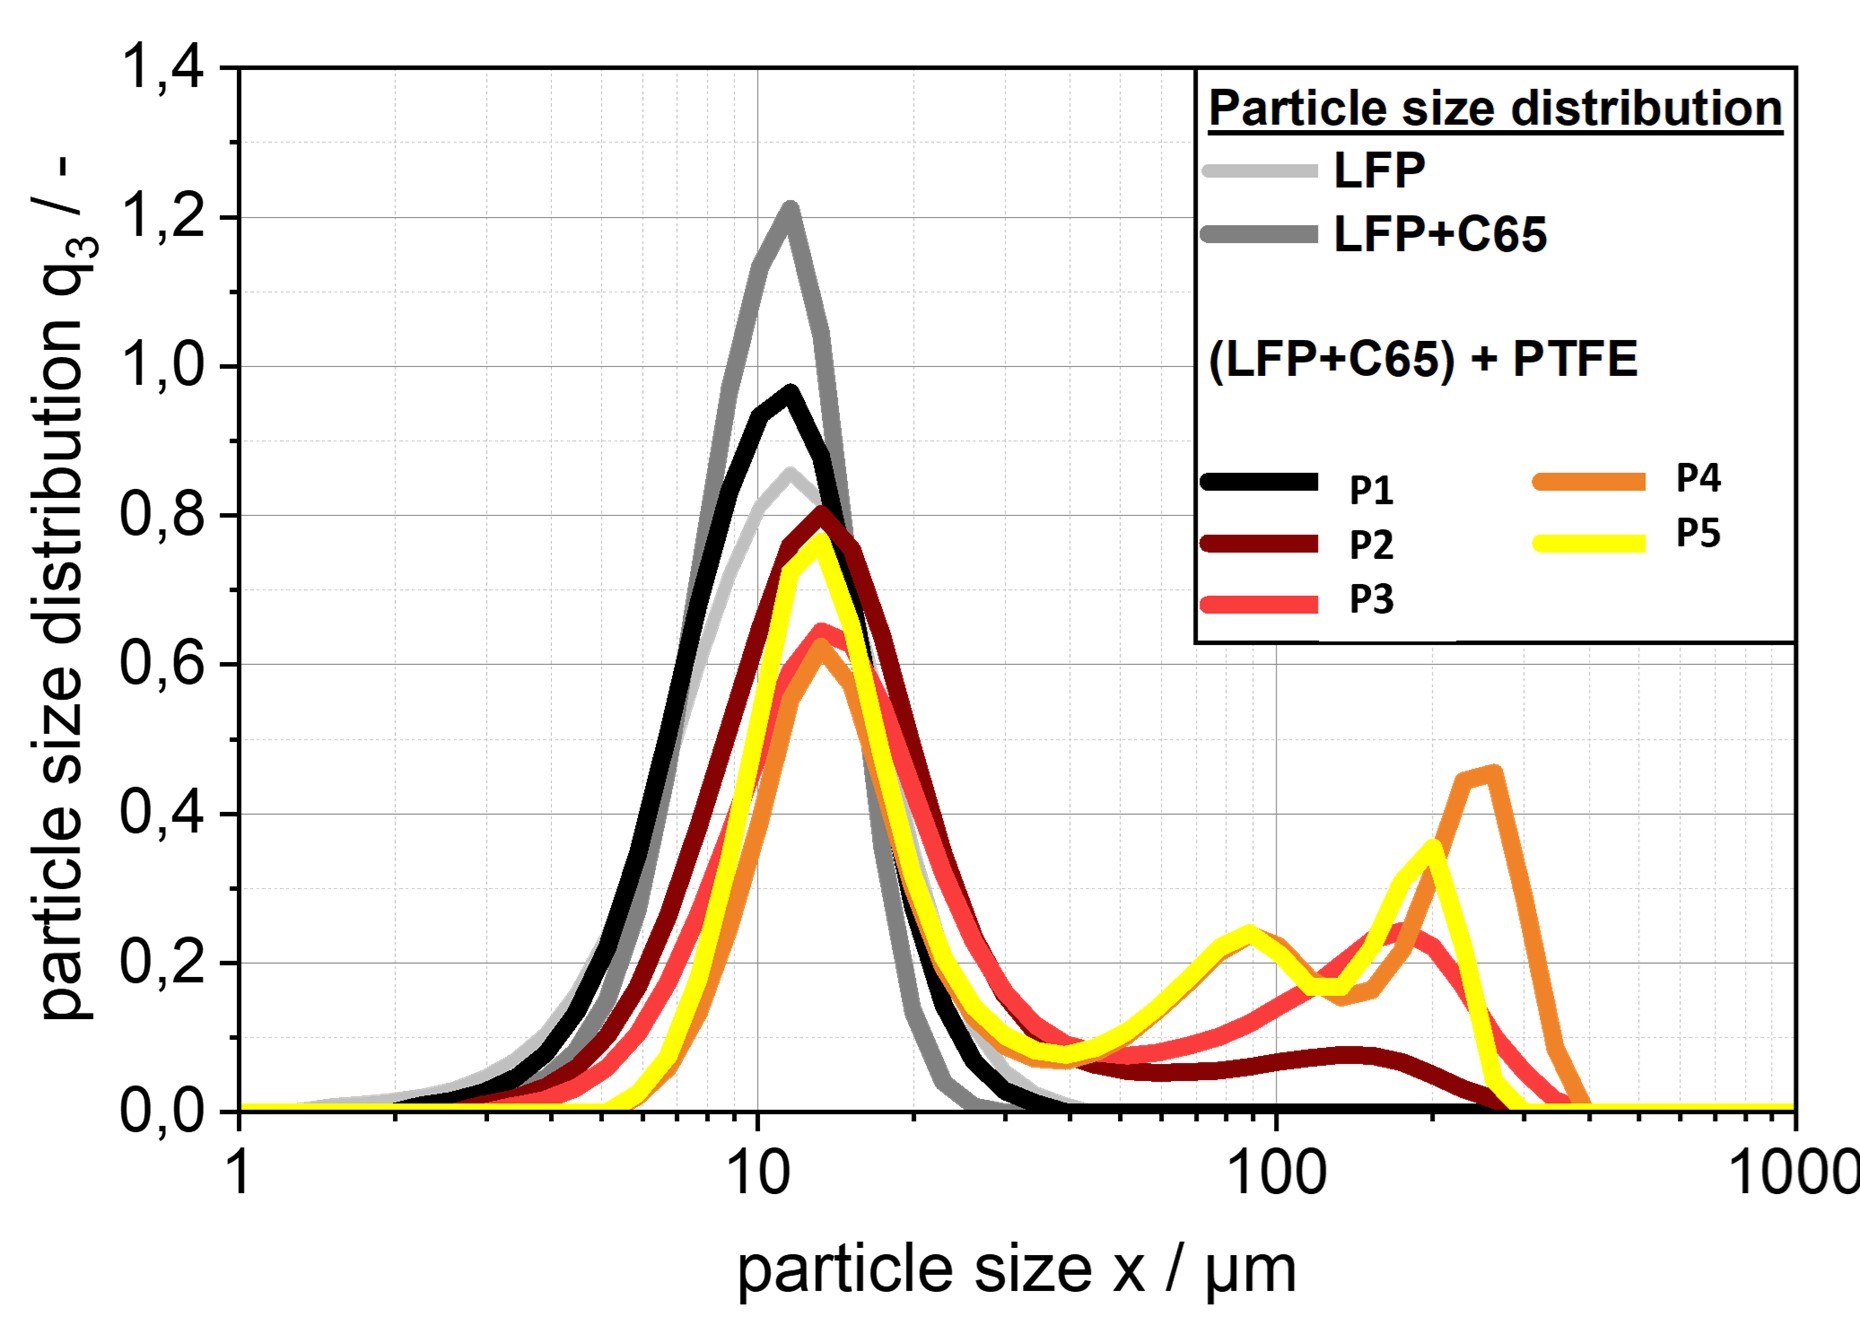
Figure 4: Particle Size Distributions by number. (Data and graphic providen by Marcella Horst, IPAT).
SEM Analysis
Experimental protocol
Pictures were taken with a Scanning Electron Microscope (SEM) to evaluate the fibrillation of the different batches and to have an idea of the typical size of fibrils. Different magnifications were used: small (X540), medium (X1000), and large (X5000).
Experimental results
Pictures of the powder fibrillated during different times are presented in Figure 5.
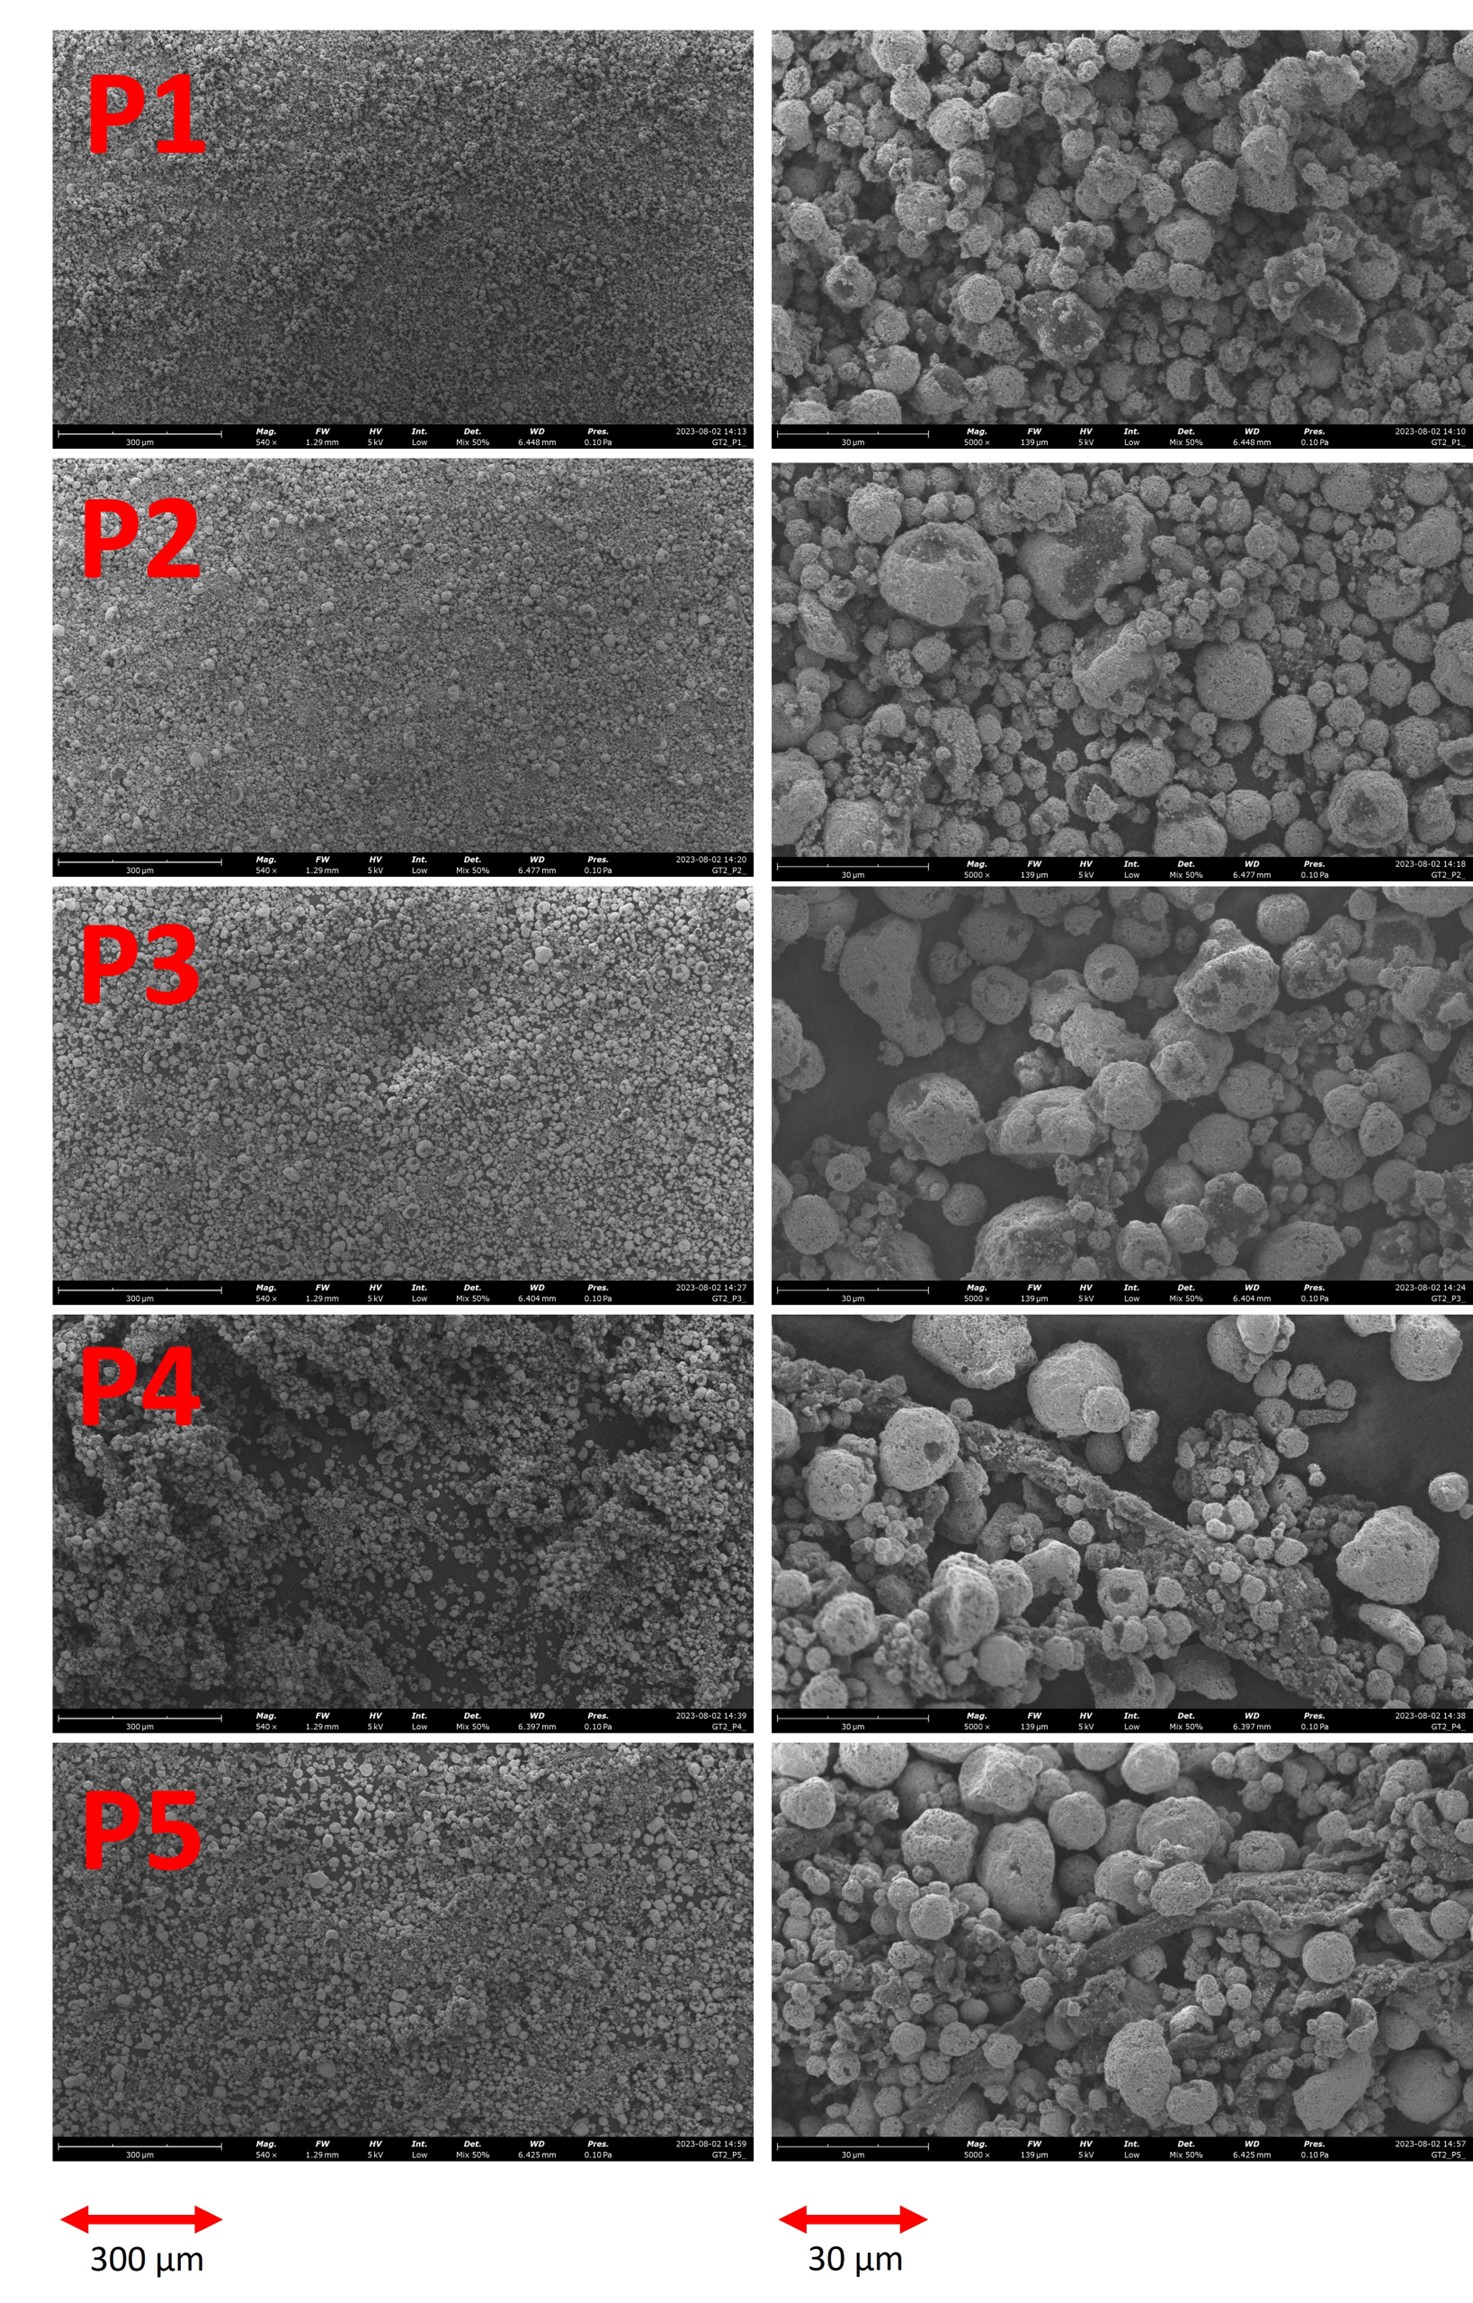
Figure 5: SEM pictures taken at different fibrillation times. The images were obtained with a magnification X540 for the left column and X5000 for the right column. (Pictures taken and provided by Marcella Horst, IPAT).
Changes can be hardly seen between the powder samples P1, P2, and P3. However, For P4, fibrils can be easily observed in the images. The lack of fibrils in the images corresponding to P2 and P3 may probably be due to the dependency of the measurement on which region of the sample is investigated. There is less chance of finding fibrils in the investigated area for powders that have fewer fibrils. Nevertheless, the formation of fibrils is confirmed with pictures corresponding to P4 and P5. The absence of fibrils in P1 is obvious since this powder was not fibrillated.
Packing Analysis
Experimental protocol
The packing density of each powder was characterized by the tapped density method. This method also named “tap-tap test”, is popular for its simplicity and its rapidity. It exists standardized procedures with specific protocols to perform this kind of measurement. However, most standardized methods have major drawbacks. The filling procedure is done by the operator which influences the initial powder volume, and the tapped volume is measured by naked eyes.

Figure 6: (left) Picture of the GranuPack. (right) Sketch of the GranuPack.
LEARN MORE ABOUT THE GRANUPACK
In this work, we used the GranuPack which removes these drawbacks with a fully automated protocol for the filling and the measurement of the powder volume. The powder is poured into a metallic tube with a rigorous automated initialization protocol. Afterward, a light hollow cylinder is placed on the top of the powder bed to keep the powder/air interface flat during the compaction process. The tube containing the powder sample rises up to a fixed height of ΔZ and performs free falls. The height h of the powder bed is measured automatically after each tap. From the height h, the volume V of the pile is computed. As the powder mass m is known, the density ρ is evaluated and plotted after each tap. The density is the ratio between the mass m and the powder bed volume V. The Hausner ratio Hr is related to the powder cohesion and is calculated by the equation Hr = ρ(1500) / ρ(0), where ρ(0) is the initial bulk density and ρ(1500) the tapped density computed obtained after 1500 taps.
From the full packing curve provided by the GranuPack, dynamical parameters characterizing the kinetics of the packing are defined: the number of taps N1/2 needed to reach half of the packing amplitude and the initial slope α at the beginning of the process. The slope index α is computed with a linear fitting ρ(n) = ρ(0) + α.n on the initial linear part of the packing curve.
For each experiment with the GranuPack, 1500 taps were applied to the sample with a tap frequency of 1Hz and 1 mm of free-fall. Measurements were repeated three times for evaluating reproducibility and the average value and standard deviation were considered.
Experimental results
The impact of the fibrillation time on the packing density of the powder obtained by GranuPack is presented in Figure 7. The numerical values for the initial and final densities ρ(0) and ρ(1500) and the Hausner ratio and the packing dynamics are presented in Table 1.
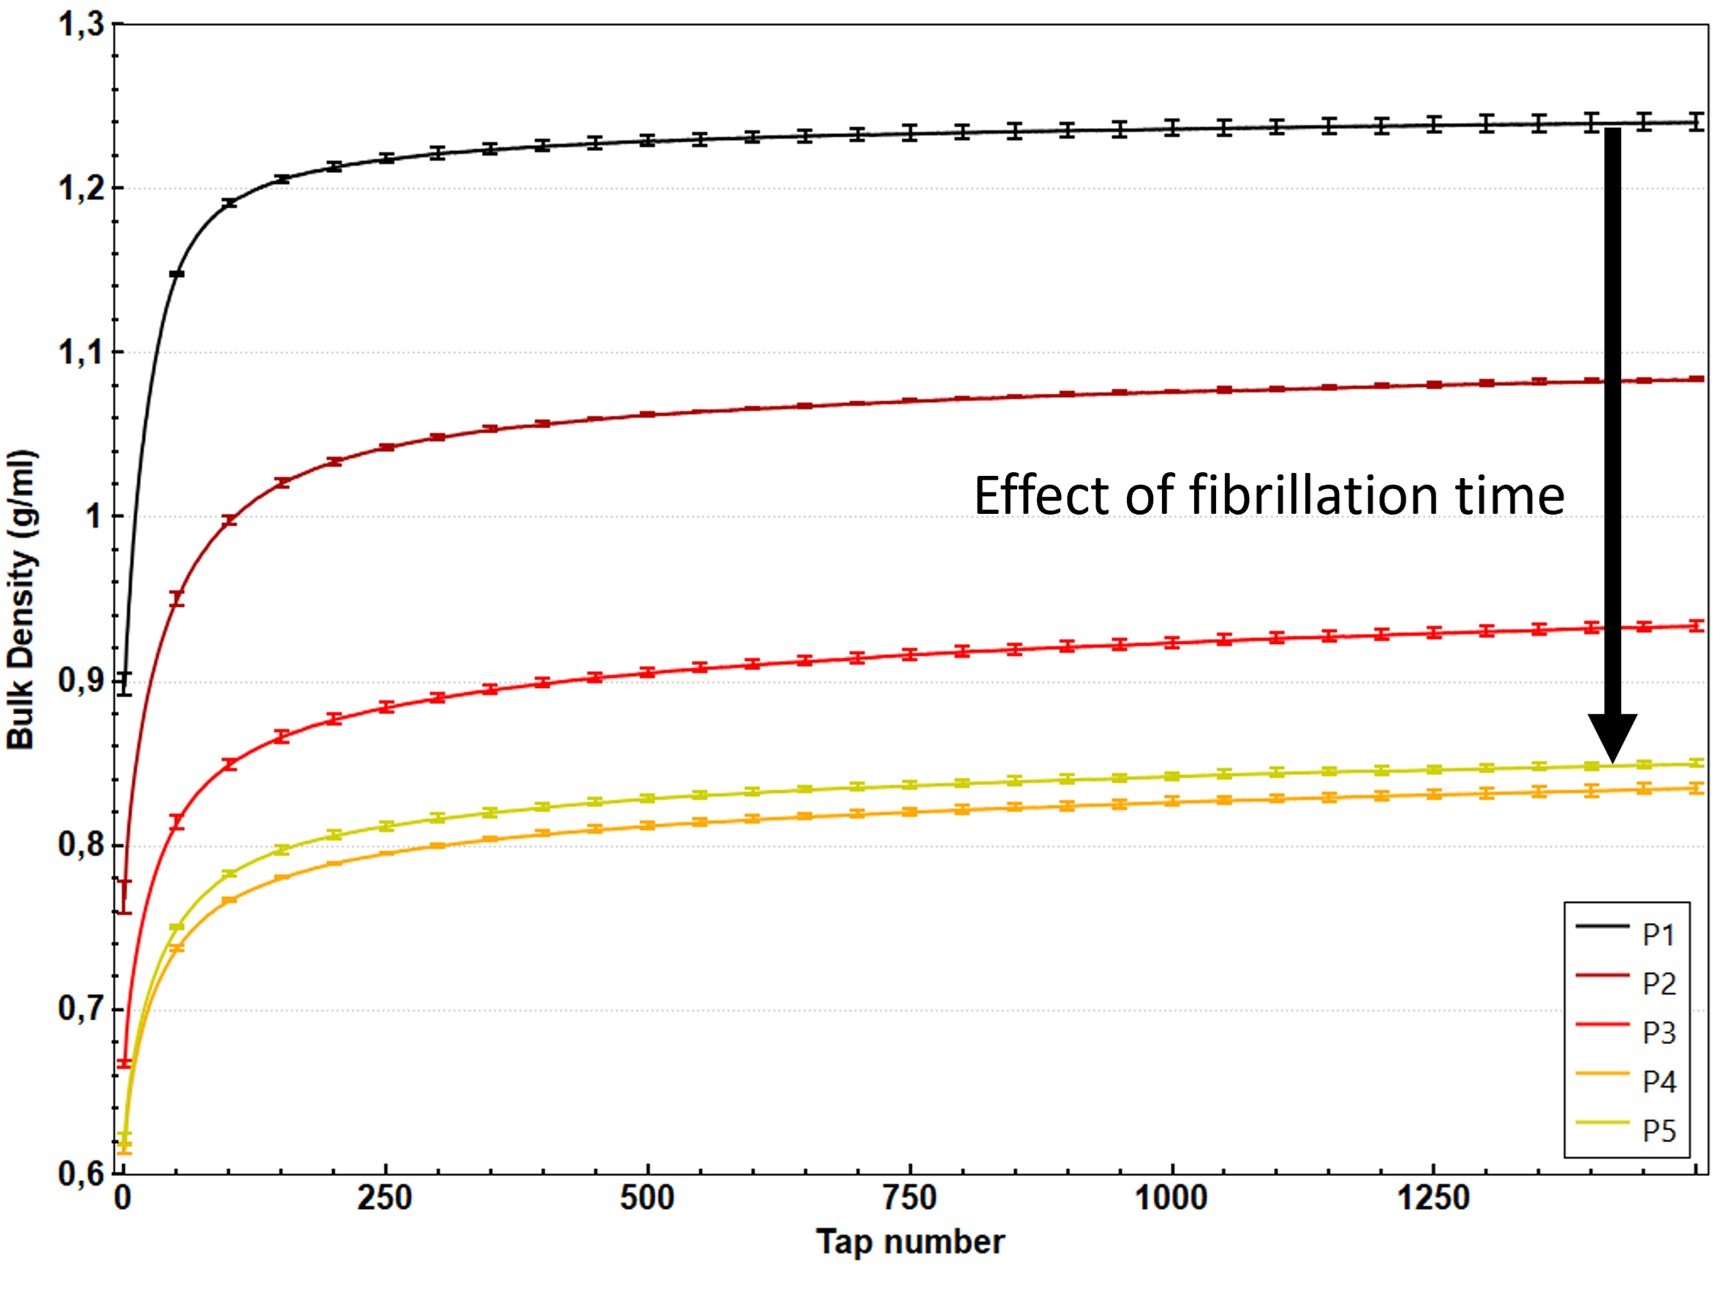
Figure 7: Bulk density variations versus taps number for all samples.
| Powder Sample |
ρ(0) (g/ml) |
ρ(1500) (g/ml) |
Hr |
α (g/l) |
N1/2 |
|---|---|---|---|---|---|
| P1 | 0.898 | 1.240 | 1.38 | 10.3 | 22.5 |
| P2 | 0.768 | 1.084 | 1.41 | 7.69 | 36.0 |
| P3 | 0.667 | 0.934 | 1.40 | 6.37 | 39.5 |
| P4 | 0.616 | 0.835 | 1.36 | 5.42 | 38.7 |
| P5 | 0.621 | 0.850 | 1.37 | 5.47 | 37.5 |
Table 1: Results obtained with the GranuPack for the three powders.
LEARN MORE ABOUT THE GRANUPACK
Significant differences are obtained between the samples. The curves are easily differentiated with no overlapping error bars. The initial and final densities decrease as the fibrillation time increases, except for P5 which increases its bulk density compared to P4. Generally, a change in density can be related to a change in cohesiveness. However, looking at the Hausner ratio does not allow to draw a trend for the cohesion as a function of the fibrillation time. Therefore, no clear evolution of the cohesiveness can be extracted from the analysis of Hr.
Unlike the Haunser ratio, the dynamics seem to bring more useful information. The parameter N1/2 quantifies the packing speed at long time. The larger this number, the more time is needed to densify. On the contrary, α corresponds to the densification speed at short time. The larger this number, the faster the powder densifies at the start of the densification process. During densification, grains need mobility to reorganize the granular pile and increase the density. The faster the densification the higher the mobility of grains. Consequently, the dynamic parameters are related to this mobility. The slope index α evolution with the fibrillation time can be seen in Figure 8. The densification speed decreases as the fibrillation time increases. This decrease is not linear and seems to saturate after P4. It has to be noted that a low α corresponds to a high N1/2, and a high α corresponds to a low N1/2 accordingly. Therefore, the mobility of particles is correlated to fibrillation.
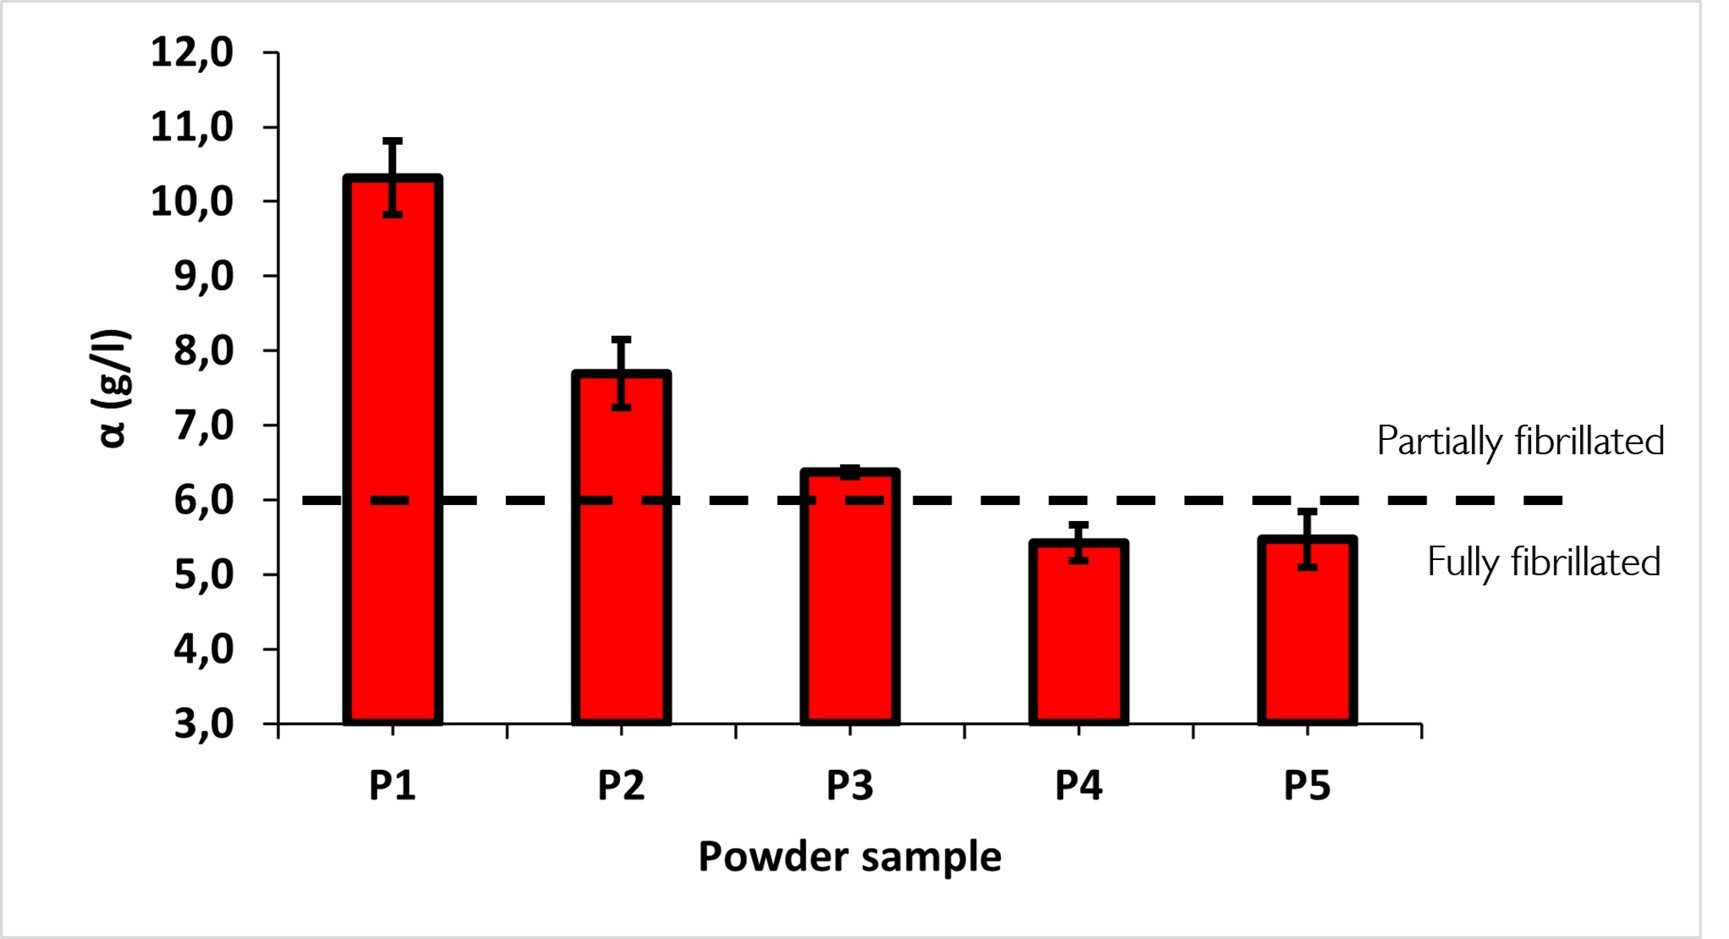
Figure 8: Evolution of the slope index as a function of fibrillation time.
Discussion and interpretation
Significant differences are obtained with tapped density measurement. The increase of α with the fibrillation time from P1 to P4 may be explained by an increase in fibril size and number, confirmed by the PSD and SEM images. Indeed, the longer and numerous the PTFE fibrils the more entanglement between these polymer chains. With the particles of active material and conductive additive, the blend constitutes a web of interconnected particles entangled with PTFE. This entanglement limits the mobility of the particles in the powder material and thus their ability to move during densification. Therefore, the densification is slowed down due to particle reorganization limited by the PTFE network and α decreases with the degree of fibrillation accordingly.
The saturation of α after P4 may suggest an optimal value of fibrillation reached before 5 min. This observed optimum would attest to an optimal time for fibrillation and a ‘’fully fibrillated state’’. Besides, the clear observation of large fibrils in the SEM images for P4 and P5 attests to the fibrillated state of these samples. Therefore, a threshold can be fixed to define the two states, ‘’partially fibrillated’’ and ‘’fully fibrillated’’, of the powder, as illustrated by the dashed line in Figure 8. Since the fibrillation of the blend requires an equilibrium between powder flowability and adequate material consistency, a metric able to highlight the optimal value of fibrillation for a powder blend is of huge interest.
The decrease in density with fibrillation time can be explained by this decrease in mobility due to fibrillation. When the powder blend is poured, low mobility implies a low ability for particles to move for packing reorganization. Therefore, the granular pile can sustain a looser packing as the mobility decreases with the degree of fibrillation. This physical explanation is well represented by experiments with granular chains as presented in Figure 2.
Conclusions
The quantification of PTFE fibrillation is an important challenge to solve for improving future dry-coating processes for battery manufacturing. Particle Size Distribution and Scanning Electron Microscope imaging are useful tools for detecting the formation of fibrils. However, these techniques show limits such as high cost, complexity of the measurement and data interpretation, and the lack of quantification. Therefore a new cheap, easy, and quantitative method is required. For this reason, the impact of the fibrillation time on the powder packing was analyzed with the GranuPack. Five samples prepared from the same initial batch were done with different fibrillation times, from 0 to 5 min, and analyzed with this automated tapped density measurement.
The bulk density and the packing dynamics are observed to evolve with the fibrillation time, highlighting the degree of fibrillation evolution, qualitatively confirmed by PSD and SEM image analysis. Specifically, the slope index α increases as the degree of fibrillation increases. This could be explained by the decrease in particle mobility as the PTFE network increases the entanglement of polymer chains (with the active material and conductive additive) with the number and length of fibrils. Consequently, the slope index α represents an adequate metric to quantify the fibrillation for battery powder blends. This metric would help in searching the optimal process parameters, such as fibrillation time, intensity, as well as the proportion of the materials for PTFE fibrillation.
Acknowledgments
The authors would like to thank the Institute for Particle Technology (IPAT) of Braunschweig and the collaborator Marcella Horst, for providing the powders, for performing all the PSD and SEM image analysis, and for the support for the writing. We thank Marcella Horst for providing pictures for Figures 3, 4 and 5.
LEARN MORE ABOUT THE GRANUPACK
Bibliography
[1] D. Dumont et al., Phys. Rev. Lett. 120 (2018).
[1] S. Li, S.Q. Zhang, L. Shen, Q. Liu, J.B. Ma, W. Lv, Y.B. He and Q.H. Yang, Progress and perspective of ceramic/polymer composite solid electrolytes for lithium batteries, Adv. Sci 7, 1903088 (2020).
[2] J. Janek and W. G. Zeier, A solid future for battery development, Nat. Energy 1, 1-4 (2016).
[3] W. Zhou, Y. Li, S. Xin, J. B. Goodenough Rechargeable sodium all-solid-state battery. ACS Cent. Sci. 3, 52-7 (2017).
[4]W. Bauer, Special features of powder technology for the production of lithium-ion batteries, Interceram-Int. Ceram. Rev. 68, 18-21 (2019).
[5] Bockholt, Henrike, et al. "The interaction of consecutive process steps in the manufacturing of lithium-ion battery electrodes with regard to structural and electrochemical properties." Journal of Power Sources 325 (2016): 140-151.
[6] H. Bockholt, W. Haselrieder and A. Kwade, Intensive powder mixing for dry dispersing of carbon black and its relevance for lithium-ion battery cathodes, Powder Technol. 297, 266-274 (2016).
[7] Nam, Young Jin, et al. "Toward practical all-solid-state lithium-ion batteries with high energy density and safety: Comparative study for electrodes fabricated by dry-and slurry-mixing processes." Journal of Power Sources 375 (2018): 93-101.
[8] Diener, Alexander, et al. "Evaluation of Deformation Behavior and Fast Elastic Recovery of Lithium‐Ion Battery Cathodes via Direct Roll‐Gap Detection During Calendering." Energy Technology 10.4 (2022): 2101033.