Battery
How GranuPack assess carbon black deagglomeration in battery manufacturing
The impact of the powder mixing step for electrode manufacturing has been investigated for three powder blends made of the same composition of raw powders with different mixing times. The influence of the mixing time on the packing density of the powder blend is evidenced by the GranuPack.


Introduction
Generalities
Batteries are very present in our everyday life: phone, pc, toys, … Lithium batteries are the most popular for use in electrical devices. While conventional Li-ion batteries with liquid electrolytes are sufficient for most applications, the emergence of new technologies such as electrical cars and the constant demand for stocking energy produced by renewable energies requires a new generation of batteries with better performances [1]. Different solutions are considered such as silicon or sulfur electrodes, Na-ion batteries, All-Solid-State-Batteries (ASSB), etc [2,3] … The common point between these different new generation batteries is the need for good control of the manufacturing process. Indeed, while the selection of the chemical threesome anode/electrolyte/cathode is important, the electrode structure influences its performance and consequently the final quality of the battery [4]. Powders of different natures are used for the manufacturing of these electrodes. Electrodes are generally composed of three ingredients mixed in powder form:
- Active material that constitutes the main part of the electrode (presented in yellow)
- Conductive additive (presented in black)
- Binder that plays different roles for good mechanical properties such as solidity adhesion (presented in green)
The active material exchanges electric charges, depending on charging/discharging cycle, with the electrolyte. The electrode must contain as much as possible this material in the smallest possible volume to ensure a high energy capacity, consequently linked to the electrode density.
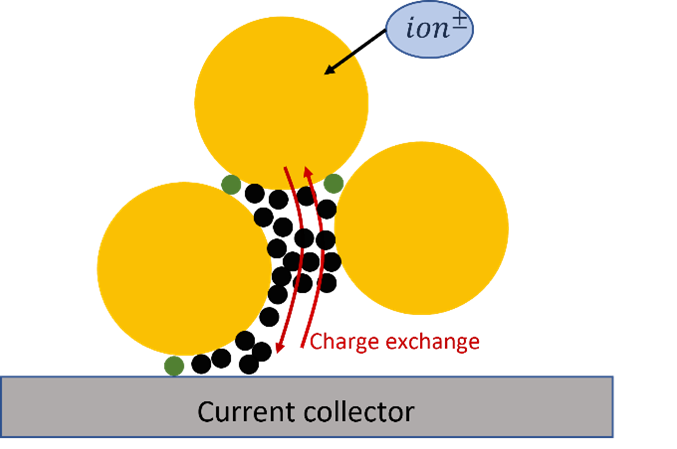
Figure 1: sketch of the three kinds of particles composing an electrode
LEARN MORE ABOUT THE GRANUPACK
Electrode Manufacturing
The manufacture of an electrode consists most of the time in spreading the mixture of these three elements on a conductive substrate, which acts as a current collector, and packaging the produced electrode in a closed cell. Different methods exist to spread the mixture on the conductive substrate [5]. A common way consists in preparing a slurry spread on the substrate and then dried by heating. The mixture can be calendered to improve the density of the electrode by decreasing its thickness and to have better adhesion. However, the cost in energy of the drying process and the dangerousness of the solvent in the slurry leads to the use of solvent-free processes. Before the spreading step, the three elements are generally dry mixed together in the powder form. This blending procedure is an important step that impact the powder blend properties. Indeed, the next steps of the manufacturing process and the performance of the produced electrode are impacted by these powder blend properties as it has been highlighted by recent works [6,7].
Scope of the study
Since the electrode manufacturing is influenced by the powder blend properties, it is necessary to determine methods that characterize the powder quality at the end of the dry mixing step. In this study, we investigated the impact of the mixing time on the packing of the powder blends. The packing analysis was done with the GranuPack and compared to the conductivity and to the compressibility analysis of the powders prepared for three different mixing times. We will show in this work that these different mixing times give different powders with different properties. The tapped density analysis performed by the GranuPack is sensitive enough to differentiate the powders that exhibit different conductivities.
Powders characteristics and preparation
Material
In this work, three powder blends for anode production were investigated. Each powder contains the same proportion of three raw powder materials: 92% graphite as an active material, 5% carbon black as a conductive additive and 3 % Polyvinylidene fluoride (PVDF) as a binder. The powders were blended with an Eirich powder mixer (1L) at 30m/s of tangential speed during different mixing times: 2 min, 5 min and 10 min. The impact of the mixing time on the powders bulk properties and performances were analysed as described in the following.
Particle size distribution
Due to the mixing of different powder components, a wide variety of particle sizes can be expected, which can influence the powder properties. Figure 2 presents the particle size distributions in volume for the three powder obtained after the dry mixing. Since the atmospheric pressure can influence the results, the particle size analysis were performed with additional compressed air and without compressed air. The dashed curves correspond to the analysis done under normal conditions (without compressed air) while plain curves correspond to the analysis done with additional compressed air. In the following of this work will focus on the results obtained at normal conditions. Table 1 shows the corresponding percentiles for the particle size distributions.
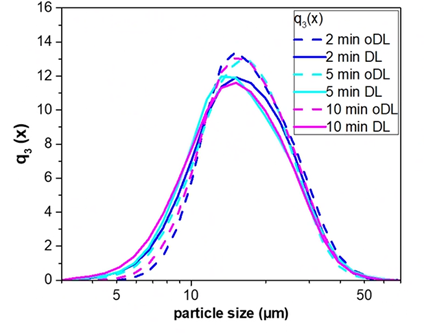
Figure 2: Particle size distributions in volume with additional compressed air (plain curves) and without (dashed curves) for the three powder blends
| Mixing Time |
2 min |
5 min |
10 min |
|---|---|---|---|
| D10 (µm) | 9.84 | 9.29 | 9.32 |
| D50 (µm) | 15.67 | 16.12 | 15.35 |
| D90 (µm) | 26.86 | 25.17 | 25.82 |
Table 1: Statistical percentiles D10, D50 and D90 for the three powder blends
One observes an influence of the mixing time on the particle size distributions. It seems that the mixing especially affects the proportion of fine particles as one sees in the left part of the curves. Indeed, in the right part, the curves are collapsed while they are slightly shifted in the left part. Figure 2 and table 1 seem to exhibit a slight increase in the proportion of fine particles when the mixing time is larger than 2 min.
LEARN MORE ABOUT THE GRANUPACK
Packing analysis
Experimental protocol
The packing density of each powder was characterized with the tapped density method. This method also named “tap-tap test”, is popular for its simplicity and its rapidity. It exists standardized procedures with specific protocols to perform this kind of measurement. However, most of standardized methods have major drawbacks. The filling procedure is done by the operator which influences the initial powder volume, and the tapped volume is measured by naked eyes.
In this work we used the GranuPack which removes these drawbacks with a fully automated protocol for the filling and the measurement of the powder volume. The powder is poured in a metallic tube with a rigorous automated initialization protocol. Afterward, a light hollow cylinder is placed on the top of the powder bed to keep the powder/air interface flat during the compaction process. The tube containing the powder sample rose up to a fixed height of ΔZ and performs free falls. The height h of the powder bed is measured automatically after each tap. From the height h, the volume V of the pile is computed. As the powder mass m is known, the density ρ is evaluated and plotted after each tap. The density is the ratio between the mass m and the powder bed volume V. The Hausner ratio Hr is related to the powder cohesion and is calculated by the equation Hr = ρ(500) / ρ(0) , where ρ(0) is the initial bulk density and ρ(500) the tapped density computed obtained after 500 taps. From the full packing curve provided by the GranuPack, dynamical parameters characterizing the kinetics of the packing are defined: the number of taps N1/2 needed to reach one half of the packing amplitude and the initial slope α at the beginning of the process. The initial slope α is computed with a linear fitting ρ(n) = ρ(0) + α.n on the initial linear part of the packing curve. The higher the initial slope the faster the packing. This dynamical parameter better describes the behavior at the initial stage of the packing for which the grains benefit from the highest mobility to rearrange.
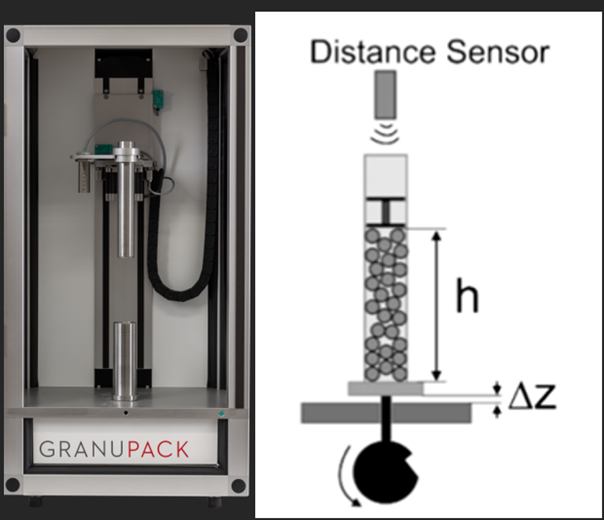
Figure 3: (left) Picture of the GranuPack. (right) Sketch of the GranuPack
For each experiment with the GranuPack, 500 taps were applied to the sample with a tap frequency of 1Hz and 1 mm of free-fall. Measurements were repeated three times for evaluating reproducibility and the average value and standard deviation were considered.
Experimental results
The impact of the mixing time on the packing density of the powder obtained by GranuPack is presented in figure 4. The numerical values for the initial and final densities ρ(0) and ρ(500) and the Hausner ratio are presented in table 2.
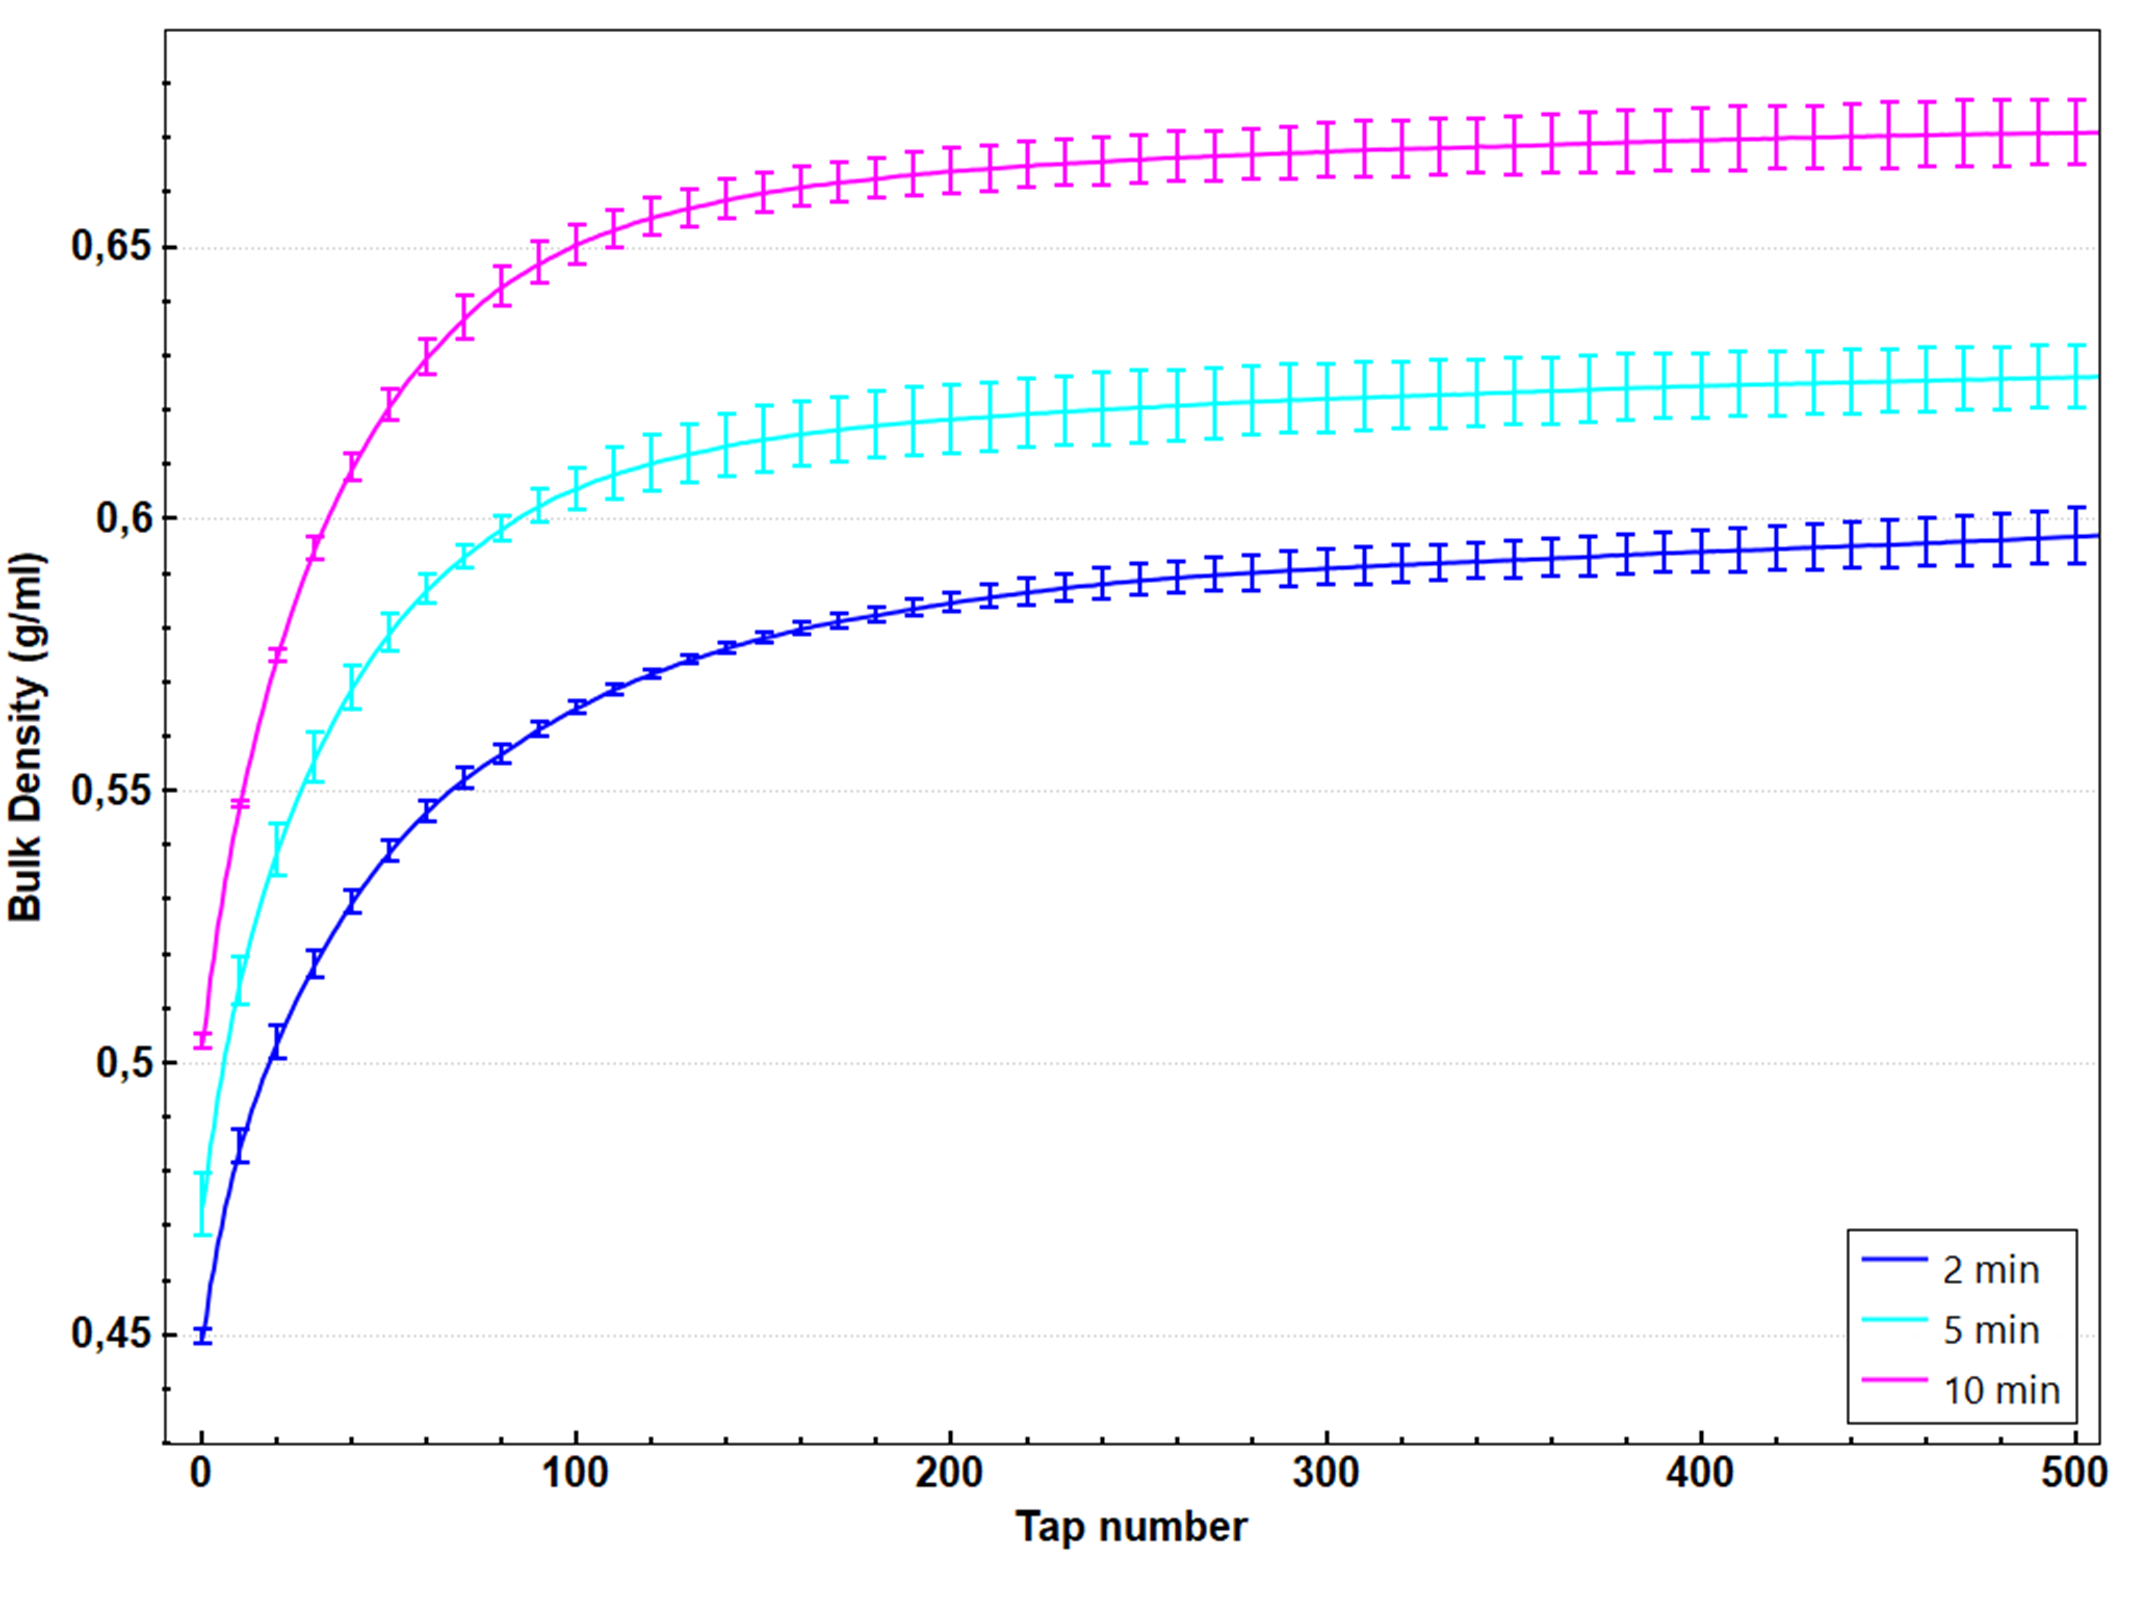
Figure 4: Bulk density variations versus taps number for all powders
One can clearly differentiate the three density curves with the GranuPack measurement. The longer the mixing time, the higher the initial and final densities while the proportion of each component is the same for each blend. This increase in density probably comes from the change in particle size. Indeed, a broader size distribution often leads to a larger bulk density because fine particles can fill the voids between larger ones.
One observes identical Hausner ratios between the three blends suggesting an identical cohesiveness, potentially leading to an equivalent processability in a manufacturing process. However, the packing dynamics seems affected by the mixing time and reveals differences between the powders with α and N1/2, especially between 2 min and the other mixing times. Increasing the mixing time decreases the compaction time N1/2, meaning a faster packing dynamics and therefore a larger mobility of the grains. This is consitent with the increase of the initial slope α. One could suppose that the difference in packing dynamics is related to the size difference generated by the mixing. These results highlight the importance of the measurement of the complete density curve. Indeed, while Haunser ratio is unable to highlight differences between the powders in this case, the packing dynamics analysis reveals these differences.
| Powder | ρ(0) (g/ml) |
ρ(n) (g/ml) |
Hr | α (g/l) |
N1/2 |
|---|---|---|---|---|---|
| 2 min | 0,450 | 0,597 | 1,327 | 3,580 | 35,0 |
| 5 min | 0,474 | 0,626 | 1,321 | 4,232 | 27,0 |
| 10 min | 0,504 | 0,671 | 1,332 | 4,497 | 26,7 |
Table 2: Results obtained with the GranuPack for the three powders
LEARN MORE ABOUT THE GRANUPACK
Conductivity analysis
Experimental protocol
The conductivity and compressibility analysis were conducted under pressure of around 1MPa. The powder was placed in an insulating cylindrical sample holder, and electrically contacted on both fronts of the powder bulk cylinder. A current of 1 mA is applied and the voltage is then measured. The electrical resistance in compressed state is calculated from the measured voltage with Ohm's law. At the same time, the packing density is computed knowing the sample weight of 1.5 g and the measured powder volume. Each measurement was repeated three times.
Experimental results
Figure 5 represents the porosity ε (linked to the density by  ) obtained under compression. As expected, one observes a decrease in porosity, meaning an increase in density, with the mixing time as observed with the tapped density measurement. The density also increases with the applied pressure. At the same time, the powder conductivity was recorded, and one can see the evolution of powder conductivity with the compaction pressure. In figure 6, the curves clearly show that the conductivity increases with the applied pressure, related to the increase in density. Moreover, one can see a difference in conductivity between powder mixed during 2 min and powder mixed between 5 or 10 min. Indeed, at high applied pressure, the conductivity clearly increases between powders mixed during 2 and 5 min. However, the curves are too collapsed between 5 and 10 min to be able to determine a difference.
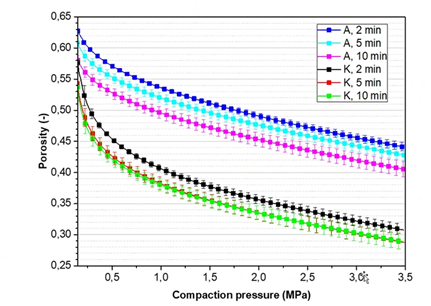
Figure 5: Porosity as a function of compaction pressure for all powders. Only curves named A are considered in this work
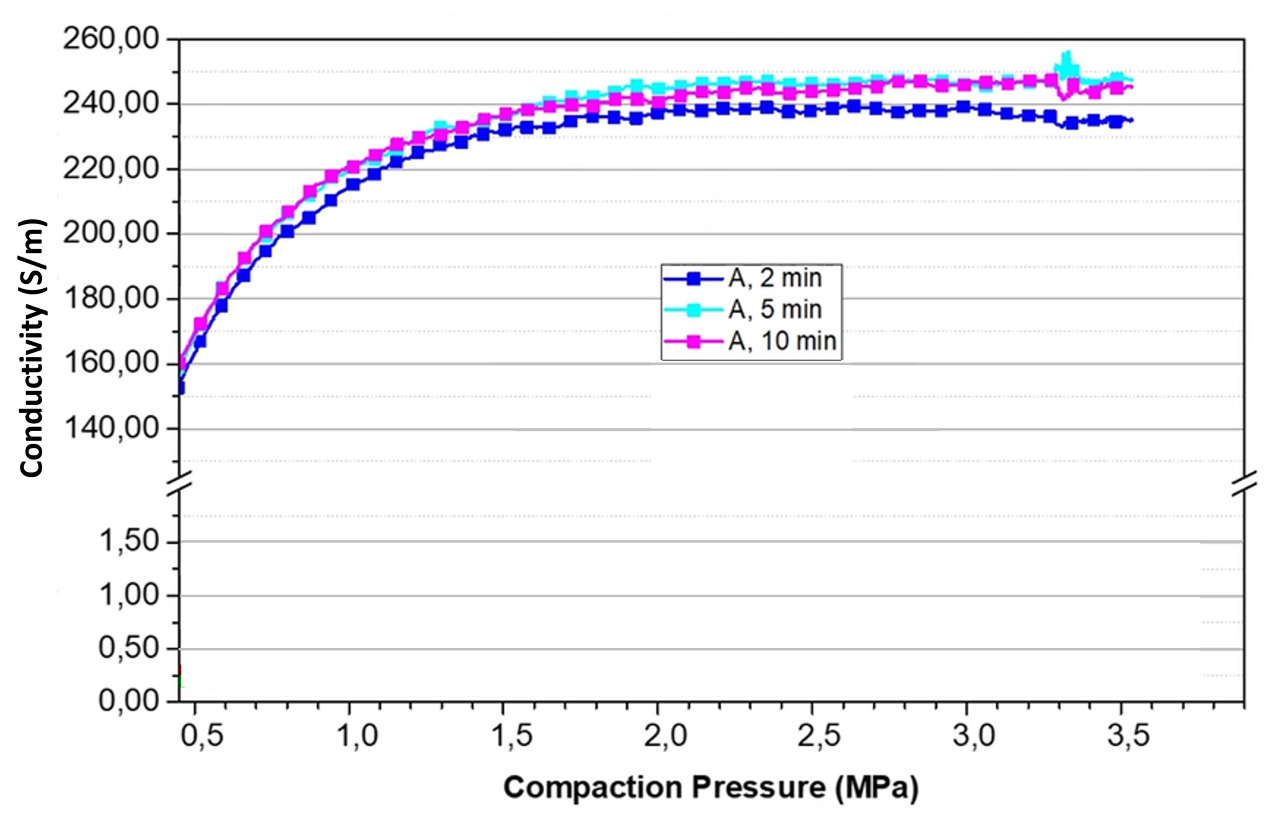
Figure 6: Powder conductivity versus compaction pressure for all powders
Discussion and interpretation
According to these results, it is clear that the mixing time for a blend preparation has an impact on the powder properties. More specifically, it is observed that the powder conductivity, which will impact the performance of the electrode after the manufacturing process, is directly influenced by this mixing time, which justifies the care taken about the powder preparation step.
In this investigation, it is observed that this change in conductive properties is related to a change in particle size distribution leading to an increase in density with the mixing time. An increased density means more particle contacts leading to a better conductivity for electrons. Based on the observations, it seems that an increase in the proportion of fine particles between 2 and 5 min of mixing time could explain the increase in density for both tapped and direct compression measurement methods. However, at higher mixing time, this proportion decreases for the particle size distribution at normal condition, whereas density is still increasing between 5 and 10 min. One assumes that the production finer particles is not the only mechanism that can explain this increase of the powder density. As suggested by Henrike Bockholt et al. (2016) [6], the production of fine particles could come from a deagglomeration of carbon black agglomerates. However, for a long mixing time, it is possible that fine particles of carbon black end up to attach to active material particles, creating a kind of coating, directly impacting the packing of particles and consequently the density of the bulk powder.
The agreement between the tapped density measurement obtained with the GranuPack and the density obtained with a direct compression method is highlighted in this work. On the one hand, the GranuPack is precise enough to differentiate powders prepared with different mixing times for a battery application. On the other hand, the consistency between density relaxation and compressed density, according to the mixing time, is interesting when considering that calendering is generally used in electrode manufacturing to increase the electrode density [8]. However, depending on the selected electrode composition, the required applied pressure during calendering is a matter of compromise between high density of the material, adequate porosity for electrolyte mobility and limitation of particle breakage or plastic deformation that also influence the battery performance. While the direct compression method for density analysis leads to plastic deformation or even breakage of the particles, the tapped density allows to evaluate the maximum reachable density without any degradation of the particles thanks to the low stress applied during the measurement.
Conclusions
The impact of the powder mixing step for electrode manufacturing has been investigated with the GranuPack. The tapped density has been measured for three powder blends made of the same composition of raw powders for different mixing times and correlated with direct compression and conductivity measurements. From this analysis, the main conclusions can be drawn:
- The mixing time has a direct influence on the packing density of the powder blend, evidenced by the GranuPack. An increase in density with the mixing time is observed. One could reasonably attribute this effect to the carbon black deagglomeration during mixing.
- This change of density is observed to affect the powder conductivity, especially between 2 and 5 min of mixing time. The small difference between 5 and 10 min suggests an optimal performance was reached.
- The increase in density due to granular relaxation as measured by the GranuPack is valuable information, complementary to direct compression. Indeed, the limitation in pressure in a calendaring step due to plastic deformation or particle breakage is hard to predict. In this purpose, the GranuPack allows a characterization of the maximum density reachable without particle alteration.
Acknowledgments
The authors would like to thank the Institute for Particle Technology (IPAT) of Braunschweig and the collaborators Marcella Horst, Gerrit Schälicke and Julian Mayer, for providing the powders and for performing all the compression and conductivity experiments.
LEARN MORE ABOUT THE GRANUPACK
Bibliography
[1] S. Li, S.Q. Zhang, L. Shen, Q. Liu, J.B. Ma, W. Lv, Y.B. He and Q.H. Yang, Progress and perspective of ceramic/polymer composite solid electrolytes for lithium batteries, Adv. Sci 7, 1903088 (2020).
[2] J. Janek and W. G. Zeier, A solid future for battery development, Nat. Energy 1, 1-4 (2016).
[3] W. Zhou, Y. Li, S. Xin, J. B. Goodenough Rechargeable sodium all-solid-state battery. ACS Cent. Sci. 3, 52-7 (2017).
[4] W. Bauer, Special features of powder technology for the production of lithium-ion batteries, Interceram-Int. Ceram. Rev. 68, 18-21 (2019).
[5] Bockholt, Henrike, et al. "The interaction of consecutive process steps in the manufacturing of lithium-ion battery electrodes with regard to structural and electrochemical properties." Journal of Power Sources 325 (2016): 140-151.
[6] H. Bockholt, W. Haselrieder and A. Kwade, Intensive powder mixing for dry dispersing of carbon black and its relevance for lithium-ion battery cathodes, Powder Technol. 297, 266-274 (2016).
[7] Nam, Young Jin, et al. "Toward practical all-solid-state lithium-ion batteries with high energy density and safety: Comparative study for electrodes fabricated by dry-and slurry-mixing processes." Journal of Power Sources 375 (2018): 93-101.
[8] Diener, Alexander, et al. "Evaluation of Deformation Behavior and Fast Elastic Recovery of Lithium‐Ion Battery Cathodes via Direct Roll‐Gap Detection During Calendering." Energy Technology 10.4 (2022): 2101033.